farming should be like baseball

Farm Management Could Take a Lesson From Baseball

If you love statistics, then you probably love baseball. Where else can you know with certainty that your starting pitcher has a propensity to throw more fast-balls than breaking pitches to left-handed batters at home during afternoon games in June under sunny skies with a slight north-west wind? While this is a bit of a tongue-in-cheek poke at the nauseating volume of stats that originate from the game of baseball, such statistics and the subsequent use of those statistics have real world applications.

I’m sure many of you have seen the movie Moneyball. (I’m sure most of you have because I watch VERY few movies, and even I’VE seen it.) As the story unfolded, there many beautiful examples of how the management team of the Oakland Athletics baseball club used statistics to improve their team. In this specific scene (I can’t recall who the player was) Assistant GM Peter Brand (played by Jonah Hill) explicitly instructs the player to “take the first pitch” during every at bat.  The reason was because through the use of statistics, and tracking the data, management knew that this player got on base more often when he took the first pitch. In the movie, it worked, and this player’s on-base-percentage increased almost immediately.

What would have happened had this team’s management not had, or used, such important information? The player may have been released, sent down to the minors, or traded to another team, the manager (bench boss) may have been fired.  Spread those “uninformed decisions” across the entire roster, and failure is sure to proliferate.

Livestock and dairy farms have been heading down the road to improved data management for years already. Average daily gain is not a new concept in beef operations. Robotics in dairy parlors bring a whole new level of data management. In conversation with a farm family that is investigating the benefits of robotics in a dairy parlor, I’ve learned that through RFID technology and a robot milker, they will be able to record and monitor milk volumes and milking frequency (a cow can come to the robot for milking whenever she chooses.) The management team can then compare results across the herd to determine which cow(s) is producing more or less than others cows under similar conditions. Informed decisions can then be made.

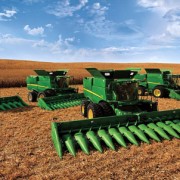
Grain farms having been catching up in recent years. With field mapping technology we can create yield maps; overlay that with crop inputs applied and we can tell which areas of each field are more profitable than others.

But that is way ahead of where most of the industry is generally at. By and large, many farm operations still don’t know the true profitability of a specific crop on their whole farm, let alone any given field.

The progression of profitability management, which requires stringent data management, begins at the crop level, advances to the field level, and reaches the pinnacle at the acre level.

Imagine:

  • determining which crops to exclude or include in your rotation by clearly understanding which crop makes you money and which one doesn’t;
  • deciding which fields to seed to which crop, or even which fields to renew with the landlord or which to relinquish based on profitability by field;
  • controlling your investment in crop inputs by acre to maximize your profit potential of the field, the crop, and your whole farm.

None of this is new. All the farm shows and farm publications dedicate significant space to all the tools and techniques available in the marketplace to facilitate such gathering of useful information. Equipment manufacturers and data management companies have invested enormous volumes of time and capital into creating tools and platforms to collect and manage your data. But like any tool, its value is only apparent when it is used to its full potential.

Almost all of the farms I speak with achieve greater clarity in the profitability of each crop in their rotation. I have a 13,000ac client that has taken several major steps toward measuring profitability by field. They have found that the extra work required to COLLECT this information is minimal. The extra work required to MANAGE this information is greatly offset by the benefit of clearly understanding that some of their rented land is just not profitable under any crop. Do you suppose they are looking forward to relinquishing some $90/ac rented land that just isn’t profitable enough to pay that high rent?

Direct Questions

Which of the crops in your rotation are profitable? Which are not? How profitable are they? Do they meet your expectations for return on investment?

Collecting the data is easy; managing the data takes some effort. What effort are you prepared to invest to make the most informed decisions possible?

How are you fully utilizing the tools available to you? If you’re not, why would you have them?

From the Home Quarter

Baseball collects gargantuan volumes of data on players, plays, games, and seasons. Much of it seems useless to laypeople like us, but to those who make their living in “the grand old game,” the data is what they live and breathe by. Agriculture should be no different. We should be creating consecutive series’ of data on our fertility, seed, chemicals, equipment, human resources, etc, for each year we operate, for each field we sow, for each person in our employ. Management cannot make informed decisions without adequate and accurate information. Now, with all the tools, techniques, and support readily available to help farmers collect adequate and accurate information, the last piece that may be missing is, “What to do with all that data?” While it can be boring to analyze data and create projections, I can assure everyone that the most profitable farmers I know all share one common habit: they spend time on their numbers, they know their numbers, and they make informed decisions based on those numbers.

You collect the information. I can help you use it. I’ll make tractor calls (as opposed to house calls) during seeding…as long as you have a buddy seat. Call or email to set up a time.

asset rich cash poor

Asset Rich, Cash Poor (Kim Quoted in the News)

A tweet led to an email, which led to a phone call…

It was back in March that I tweeted the following:

This, and the short Twitter conversation that followed it, garnered an email, and then a telephone interview with Jennifer Blair from Alberta Farmer Express.

Below is an excerpt of what she wrote. For the article in its entirety, click here.

” ‘The funny thing about prosperity and successive years of prosperity is it allows people to form some really bad habits,’…

…And for those producers, being ‘asset rich and cash poor’ isn’t going to cut it anymore.

‘When you look back over the last two generations, it seems like the mantra has been that farmers are ‘asset rich and cash poor.’ It’s almost worn like a badge of honour,’ said Gerencser… ”

Direct Questions

What do you think? Have assets, especially equipment, been increased too fast to the detriment of cash holdings and future cash flow?

What is a reasonable level of investment in assets relative to your net profit? Are you earning an adequate return on your investment?

From the Home Quarter

Bad habits can form easily, but like any habit, bad ones can be broken. Chasing equity is something we’ve always done and that may have worked a generation ago, when the risks were as they are today but the volumes of cash at risk each year were far less. We cannot do what we’ve always done and expect a result different from what we’ve always gotten.

Asset rich and cash poor will not suffice through the next business cycle.

I’d like to hear your thoughts; leave a Reply below.

ROI and ROA equipment

Farm Acronym Challenge: ROI and ROA

ROI (return on investment) is a metric I lean on heavily when working with clients to illustrate an expectation of profit. Each farm deploys (what feels like) unprecedented volumes of capital every year in an effort to grow a crop; there should be an expectation of profit for doing so, and I expect my clients to demand an ROI that reflects the risk they take. Accepting lesser returns is insufficient and could be realized with less risk by deploying said capital elsewhere.

We can break down ROI by measuring a return on various aspects: crop inputs, investment in equipment, annual cash costs, etc. Some of the many options against which we can measure ROI are highly useful, others less so. We try to decide which metrics to measure based on which gives us the most useful information. Of course, the ability to have an accurate measurement of ROI depends entirely on quality information and your ability to collect it.

ROA (return on assets) is a measurement I will be using more in the future than I have in the past. More and more I am finding that there are excess assets on farms, especially equipment, that are using good capital yet providing an inadequate return.  Here is what I mean.

ROA is defined as a company’s net earnings relative to total assets. By dividing net earnings by total assets, we see how efficient management is at using assets to generate profit. A company that generates $1,000,000 in net earnings on $5,000,000 in assets has a 20% ROA. A similar company generating $1,000,000 profits with $10,000,000 in assets has a 10% ROA. It’s simple math. And the question begs: if you had invested $10,000,000 elsewhere, could you get better than a 10% return on those assets?

Before the argument about land values is thrown out there, let’s just curb it right away. Yes, ROA can be manipulated (as can ROE – return on equity) by owning fewer assets. Banks do it all the time: they sell their owned real estate such as stand alone bank branches and ivory office towers in order to lower their total assets, thereby making their profitability (when measured as ROA) look fantastic.

Today, let’s focus on the asset that gets much love: farm equipment.

How would we measure ROA when it comes to farm equipment? I prefer to use Fair Market Value (FMV) because that figure represents both what it would cost you to acquire said asset and what you could reap should you sell said asset; it is arguably the asset’s intrinsic value. Online searches and blue book values are great ways to validate FMV. I summarize it as “when the auctioneer’s gavel drops, what would you get for that piece of equipment?”

Focusing on ROA as it pertains to equipment only, and excluding land, levels the playing field so to speak. All things being equal, this approach will clarify which farm management team is efficient with how it invests in equipment, and which is not.

Direct Questions

How do you measure the effectiveness of your investment in assets, specifically equipment?

Are you over-invested or under-invested in equipment? What evaluation methods do you use to validate your position?

If you were to invest your capital elsewhere, what return would you expect? What return do you expect from your farm? Is there a difference? Why?

From the Home Quarter

When calculating ROA, consider multiple criteria: all assets (land, buildings, equipment;) land and equipment only; equipment only. The ROA will obviously be much lower when including more assets, but don’t let that sway you into selling land to improve your ROA. Land ownership has been, and will continue to be, the anchor of a farm’s wealth.

What is a target ROA? The jury is still out. Simply put, there isn’t a large enough sample with adequate accurate information available to draw from.

So let’s find out!

With the utmost confidence and maintaining your privacy always, I am proposing an experiment: Email to me your net earnings, your cultivated acres, and your fair market value for each of land, buildings, and equipment for 2015. I will compile the data with no identifying criteria so that you maintain privacy. The compiled data will be available only to those who take part in the experiment. Include 2014 and 2013 as well if you’d like to see how you are trending.

As a thank you for taking part, Growing Farm Profits will offer an analysis with feedback on your ROA  and ROI calculations and trends at NO CHARGE! (Normally a $470 value!)  – Offer expires April 20


grain terminal

Outlook for Cash

The biggest issue that I am working on with clients right now is cash. Cash continues to be tight at the farm gate, and our ability to predict cash flow is, as it always is, difficult. Even when we can contract grain sales with an adequate price and delivery date, the likelihood of actually being able to deliver as per the contracted date is often low. The challenges of managing debt and payables under those type of situations can be debated for days. We won’t berate it now.

As we look back over the last few years, we can identify what led to the current cash shortages. There is no point chiding anyone for those past decisions. What is in the past cannot be changed; we must acknowledge it and learn from it. After all, if we don’t learn from history, we’re doomed to repeat it.

Here are 3 strategies for managing cash as developed from my years in commercial lending and working with farmers on financial management:

Be conservative with projecting cash inflow.

Cash outflow has been allowed to increase lock step with, and sometimes outpacing, increases in cash inflow. This despite everyone knowing that farm cash inflow can be as unpredictable as the weather. Now we see many operations that are facing cash inflows like 2008 on required cash outflows of 2016. Calling the situation “tight” is at times an understatement.

Consider your lowest profit year in the last 10 years, and use your cash inflow from that year to compare it against your required cash outflow for 2016. How does that make you feel?

Protect working capital.

Recently, I tweeted, “Asset rich and cash poor will not suffice through this next cycle.” Many farms have squandered their opportunity to fill their working capital war chest because of large assets acquisitions and taking on significantly more debt for those acquisitions. Now, many of those same farms are borrowing every penny needed to operate the farm through a growing season. Working capital will be the greatest source of opportunity in the coming years. Access to adequate working capital could be the most limiting factor.

I read a piece recently that interviewed Dr. David Kohl (who I’ve quoted in the past.) Dr. Kohl says that his belief is the 60:30:10 profit plan. Of your farm’s profits, he says that 60% should go to growing the farm and making it more efficient, 10% to dividends, and 30% to working capital. Considering the general lack of working capital on currently on the farms, I suggest that the rule, in the short term anyway, be more like 80/20 with 80% of profits going towards building working capital and 20% going towards growth and efficiency; dividends might just have to wait.

Actually create and maintain a running cash flow statement.

Going through the exercise of constructing a monthly cash flow statement is often an “A-Ha” moment. Being able to clearly identify where and when your cash is flowing helps you understand how and when to best use operating credit, plan grain sales, or structure payment dates. While it is not new news anymore, it is worth repeating: set your payment dates for when you’ll actually have cash!

This is also a beneficial step to improving the relationship you have with your lender. When you can look your lender in the eye and tell them exactly how much operating credit you need, when you’ll need it most, and when you’ll pay it back shows that your focus on management is meeting their expectations.

Direct Questions

What changes would you make to your 2016 plans if you knew your cash inflow would be similar to your worst year in the last 10?

How have you invested your profits? How will you invest future profits?

What does your 2016 monthly cash flow projection look like?

From the Home Quarter

The outlook for cash will reach critical importance in the near future. Working capital will be the fuel for your growth in the coming years. Equity is the backstop. Equity does not pay bills, cash does. When cash is gone and unlikely to return, tapping into equity can replenish working capital, thus the “backstop.” The chase for equity over the last several decades in an effort to be “asset rich and cash poor,” like it was a badge of honor or something, has created a generation of farmers who would prefer to be rid of debt to the detriment of working capital.  It might be possible to finance growth and expansion without cash, but it is not possible to operate it.

4 R's of Fertility

Easy, Efficient, Effective, or Expensive?

Let’s get it right out of the way first: I am not an agronomist.

I do, however, have a solid base of understanding relating to agronomy. With tongue in cheek I like to say, “I know enough to be dangerous.” Nonetheless, I took great pride in the significant attention to detail I employed while being in charge of seeding when still part of the farm. I carefully measured TKW (thousand kernel weight) and calculated seed rates accordingly. I was diligent about what fertilizer, and volume of fertilizer went into the seed row (we only had a single shoot drill.) I always slowed down to 4mph or less when seeding canola and ensured to reduce the wind speed to the lowest possible rate to minimize the risk of canola seed coat damage.

I always had a long season in spring from having to cover the whole farm twice: once with a fertilizer blend to be banded, (all of the N and whatever PKS that couldn’t go in the seed row) usually at least 2″ deep; the second pass was with seed and an appropriate PKS blend that could be be in the seed row. It’s just what I did to respect what I’d learned about the importance of fertilizer rate and placement. It took more time in applying, hauling home, storing, etc. It created operational challenges during application (it seems there were never enough trucks and augers available.) It took more time to set the drill for the correct application rate. All of that didn’t matter to me because I only had once chance to get the crop in the ground and fertilizer properly applied (at least at that time, the equipment we had made it so that all fert was applied in spring) and I wasn’t going to leave anything to chance that I could easily control.

The key point in fertilizer management is “The 4 R’s.” Right source, right rate, right place, and right time of fertilizer application make for the best use of your investment. So why over the last number of years have we seen such a boom in spreading fertilizer on top of the soil?

This article was recently published by FCC. There is no ambiguity as to the best and most effective way to apply phosphorus. I’ll ask again, “What’s with the shortcuts?”

I know the answer: time. There isn’t time to incorporate adequate volumes of fertilizer into the soil. We can use a spinner that has a 100′ spread at 10mph (or more;) this permits more fertilizer to be applied in a shorter amount of time, and it permits fewer stops to fill the drill during seeding…all of it saving precious time. I get it.

But where is the trade off? Have The 4 R’s of Fertility been tossed aside completely? Where is the balance?

Casting aside the proven science of the 4 R’s in order to save time by broadcasting is easy and efficient, but is it effective? I suppose that depends on what effectiveness you are trying to accomplish. I’m suggesting effectiveness of the fertilizer you’ve paid dearly for.

Direct Questions

When making important management decisions like fertility, what methods are you employing to determine your best strategy?

Where is your balance between ease, efficiency, effectiveness, and expense when making critical management decisions?

How has your Unit Cost of Production projection changed if you decide to accept only 80-90% effectiveness from your fertility program?

From the Home Quarter

What is easy might seem efficient, we might believe it is effective, but it is most likely expensive. Historically, decisions were made with the goal of minimizing expense with little else given to consider ease, efficiency, or effectiveness. Management decisions that do not provide adequate emphasis on effectiveness will likely see higher expenses. Your focus with your agronomy must be to produce at the lowest Unit Cost of Production possible on your farm. Choosing a fertilizer application method that places more emphasis on that which is easy versus that which is most effective is likely to create a situation that is expensive. Management decisions that focus heavily on one aspect to the detriment of the others rarely achieve results that meet or exceed expectations.

Introducing the Growing Farm Profits 4E Management System™. Details to follow.

bin row

Crop Price Rallies (will be) Few, (and) Short

That is the headline in the recent edition of The Western Producer. Penned by Sean Pratt and primarily sharing the views of Mike Jubinville, the article contains the usual verbiage found in most articles that get classified under “commodity outlook.” Here are some of the biggest points made by Jubinville in the article:

  • The commodity super cycle is over.
  • We’re into a new era of a sluggish, more sideways rangy kind of market.
  • Canola is not overvalued and Jubinville feels that $10 is the new canola floor.
  • Wheat should bring $6-$7/bu this year.
  • $10 for new crop yellow peas is a money making price.

This last point gets me. If I had a dollar for every article that claimed a “money making price” on a commodity in such general terms, I’d be making more money! In all the thousands of farm financial statements I’ve reviewed over the years, I can say unequivocally that there are no two farms the same.

In saying that, it is abundantly clear that what is a profitable price on one farm may not be a profitable price on another. And just because $10 yellows may have been profitable last year does not for one second mean that $10 yellows will be profitable this year. Why? It depends entirely on the choices you have made in changes to your business, as well as on the differences in a little thing called YIELD.

Yield can make a once profitable price look very inadequate very fast. In fact, a 15% decrease in yield, from an expected 45 bu/ac to 38.25bu/ac, requires a 17.65% increase in price, from $10/bu to $11.76/bu to equate to the same gross revenue per acre. This factor is not linear: an 18% decline in yield requires a 21.95% bump in price to meet revenue expectations. Alternatively, an 18% bump in yield requires a price that is 15.25% lower than expected to meet the same revenue objectives.

The point is if yield is down, achieving the objective price may not be profitable. Or at the very least, it would be LESS profitable. But the bigger issue is this: How can it be stated what is or is not profitable without intimate knowledge of a farm’s costs?

If the farm’s costs and actual yield create a Unit Cost of Production of $10.20/bu, I’m sorry Mr. Jubinville, that “money-making” $10/bu price you mentioned is not profitable!

Direct Questions

How are you determining what is an appropriate and profitable selling price for your production?

What are you doing to ensure you are including ALL costs incurred to operate your farm?

If you find that your projected Unit Cost of Production is not profitable, what measures are you taking?

From the Home Quarter

Far too often, we can get caught up in making critical business decisions based on what we “think” is appropriate, on a hunch, or on pure emotion. Using Unit Cost of Production calculations to validate your farm’s profitability is an incredibly empowering exercise. I’ve been in a meeting with a client and witnessed the entire crop plan change during the meeting based on Unit Cost of Production information.

What is not measured cannot be managed, and measuring your profit is pretty darn important.


barometer

Farm Business Barometer

It’s harvest time. The weather has been uncooperative. The crop is generally not ready to go. Quality is diminishing. The August and September contracts Fred* had in place will not be delivered on time, even though the elevator has room, because his grain is still in the field and not in the bins. (* Fred isn’t anyone in particular. This story is fictional, but we need a lead character and decided to call him Fred.)

Finally, it looks like the weather will break, forecasting two weeks of high pressure, clear skies, and warm temperatures. Fred even has enough help between the hired staff, and family who have offered to come home for a week or so. He must get this crop off quickly, as fast as possible. Fred needs another combine.

Fred cannot afford to think about this for too long; everyone is in the same situation, and they could be looking at adding a combine to their farm as well. He heads into town, speaks with his salesperson, and acquires a quote. It’s higher than he wanted, or was expecting, but Fred is in a bind. He just heard that there are 2 other quotes on the same unit. He writes the cheque for a deposit.

Now comes the hard part – seeing the banker.

Fred recalls the feedback he was given before seeding time: things have been a little tight, and pulling back on any capital expenditures for a couple years would be best. What if this gets declined? How will he get the crop off in time? Is his deposit refundable? Fred scolds himself for not asking when he wrote the cheque.

Fred arrives at the banker’s office unannounced. Luckily she’s in the office today. Thankfully he doesn’t have to wait long. He explain the situation: things are getting worse by the day with poor weather degrading crop quality, and thereby crop price; he has lots of help to run extra equipment to get harvest done in record time…if he had another combine. When she asks if a decent combine can even be found at this juncture, Fred proudly produces the quote he just received no more than a half hour ago. She says she’ll take a look at things, and call right after lunch.

Fred heads home. The temperature is climbing and the wind is blowing; he thinks he could maybe get going this afternoon. Everything is serviced and ready to go; after all, he’s only done 150 ac so far. Fred heads in for lunch early, hoping that will speed up the call he is anxiously awaiting from the banker. He scans his phone for afternoon market updates, text messages from any neighbors who might be rolling, and that critical phone call from the banker that just isn’t coming fast enough.

He can’t sit around; Fred fires up the combine to go out and get a sample. The wheat sample looks bleached. He figures he’ll be lucky to get a #2. Sticking his hand in the pail Fred thinks “It feels close.” He rushes back to the yard to test it: 14.8! That can go in aeration! Let’s go!

Fred reaches for his phone to let everyone know to get ready to go, but realizes he left it in the combine in the field from which he just took a sample. Fred jumps in the semi, and even though it hasn’t warmed up enough yet, he hustles out to the field. Word will get to everyone via the house phone, and they’ll get out to the field right away.

Once back in the combine cab, Fred finds a message on his phone: it’s the banker! She wants him to call her right back. He does, and the call goes straight to voice mail. Fred swears.

She calls back in the time it took to fill one hopper. As Fred unloads into the truck, she tells him that she cannot approve a loan for the combine. She says that Fred’s cash flow is too low and his debt levels are too high to take on another liability for a “nice to have” asset. She talks about other options for this harvest, and offers clear feedback on what needs to happen in the future to not have these kinds of interactions with her again, but Fred has already stopped listening because he’s moved on to thinking about who else he can call for financing, wondering if the dealers program can turn an approval in less than an afternoon…

Fred immediately calls his salesperson at the dealer, and a couple other leasing companies, to ask them to begin an urgent credit application. They’ve got all his information now; he’s been in touch with them a couple times this year already when the banker has denied his other requests. Fred begins to wonder why he even bothered with the bank this time.

An hour later, Fred gets a call from the dealer; their financing division has approved his combine loan application. The interest rate is higher than his other loans, and the payment terms are more rigid, but he is not worried about that now – Fred can get that extra combine!

Jubilation turns to anxiety: the dealer cannot deliver until next week, and it hasn’t been through their shop. Fred will need to invest a half-day to have someone drive it home (who can be freed up to do that now that the harvest is rolling again?) Fred realizes this combine will probably need some repairs and some parts (more trips to town on the weekend.) On top of all that, he realizes that he’ll have to shut down himself to go in to town, sign the loan, sign the equipment sale agreement, and hopefully get to the insurance office before they close for the weekend. At this point, Fred might as well drive it home himself!

Yup, having a 3rd combine will make short work of Fred’s 5,300 acres! He acknowledges that he’ll have a serious amount of harvesting capacity for his farm size, and despite what he was told by the banker in spring and again today, Fred still got approved the loan. And if Fred got the loan, his business can’t be in as bad of shape as the banker says, right?

Direct Questions

Why does Fred exclusively use his creditor’s approval or decline of his credit applications as the barometer of his business’ financial stability and position?

How does Fred account for the differences in lending criteria and motivations between creditors when using their feedback as his business barometer?

What do you use as your barometer of business health?

From the Home Quarter

In our story, Fred clearly does not take the time, nor does he have the interest in understanding the financial ramifications on his business from the emotional decisions he makes. He continues to forge ahead by using any and every source of credit he can grasp. What happens when his requests are denied? Is it only then that his farm is in a position of financial weakness?

When focusing on priorities, I advise my clients that there are often times more important issues than upgrading equipment and constructing more buildings because credit is (relatively) easy to get, and has been for some time. As such, using credit approvals as the only, or primary, business barometer is narrow in scope, biased in feedback, and lofty in risk.


farmer tailgate computer

Farm Profitability Indexing

Farm Profitability Indexing

Late in 2015, I picked up on some interesting farm financial info during a presentation I attended as a part of CAFA. This information represents farms from a geographically vast cross section and revealed some interesting trends:

1. Gross Revenue per Acre has Trended Up

Gross Revenue bar chart

With 2007 being the base year with a value of 100, and also being the first year of the bull run in commodity prices, we can clearly see that while gross revenues are trending up, there is still great volatility in gross farm receipts. True, weather anomalies had a significant effect, but that’s farming, isn’t it?

2. Investment in Crop Inputs per Acre has Trended Up

Inputs bar chart

While gross revenue has seen volatility, and for three years including 2009-2011 gross revenue was at or near 2007 revenue levels, investment in inputs has only once seen a reduction year over year. In 2013, investment in inputs was 77.5% higher per acre than it was in 2007.

3. Gross Margin per Acre has Trended Up

Gross Margin bar chart

While gross margin is trending up, there was a significant decline in 2009 from the previous year that extended right through 2011. Even by 2012, gross margin had not returned to 2008 levels.

4. Operating and Fixed Costs per Acre are Trending Up

Oper and Fixed Costs bar chart

This figure would represent operating costs such as fuel, labor, and equipment costs, as well as fixed costs such as interest, land, and building costs.  Notice the steady increase that has never went down year over year, even through the low margin years of 2009-2011 operating & fixed costs continued to rise.

5. Net Income per Acre has Rebounded from Significant Reductions

Net Income bar chart

Net Income represents what is left over after operating your business, that profit which remains to cover administrative costs, make principal loan payments, and cover that other insignificant cash requirement: living costs (that was sarcasm if you couldn’t tell.)

In this illustration, we have calculated Net Income simply as Gross Margin LESS Operating & Fixed costs. Here we see that the low margin years of 2009-2011 actually extend right to 2012 with net income still below that of our base year 2007. This is the residual effect of increasing costs during a period of low margins (2009-2011) by continuing to have a negative effect on what would otherwise be a successful year in 2012.

Everything Dips but Expenses

This chart illustrates a dangerous trend: even when income goes down, operating & fixed expenses are allowed to continue to rise.

farm profitability line chart

By the end of 2011, net income had dropped to less than 30% of 2007 levels, yet operating and fixed costs were over 145% of 2007 levels. It took 2013 bringing about the largest crop in maybe forever to elevate net income back to 2007 levels.

Direct Questions

If Net Income represents the funds you have generated to cover living costs and make loan payments, how well does your worst net income from the last 10 years cover your living and loan payments in 2016?

What does the trend of your gross income, input costs, operating costs, and net income look like since 2007? Is it similar to what’s been presented here? What changes have you made to your operation based on your own information?

Gross margin should ideally be in lock step with operating and fixed costs. If you aren’t increasing your gross margin, why are you increasing your costs?

From the Home Quarter

This is a very telling experiment, but it is not the rule on all farms. The information presented here is an average across a list that spans all regions of the prairies, but heavily weighted on Saskatchewan. The experiment gets more interesting when you apply it to your own business. To lean on the 5% Rule first promoted by Danny Klinefelter, if in 2013 you could have been 5% better than the average in gross revenue, input costs, and operating & fixed costs as presented here, your net income would be 44% better than information presented, and index to 152.14% of the 2007 base year.

How does that sound?


equipment efficiency

Managing Operating Efficiency

“You can’t manage what you don’t measure.” It’s been said time and time again, by me and many others. Here is an example that should get everyone buzzing.

A client of mine recently shared a sample of information that they collected from their equipment. The information shared with you is specifically from their sprayer:

Sprayer Utilization pie chart


A simple pie chart creates an “A-Ha Moment” that no one saw coming. I am sure you can all imagine the conversation around the table when this information was presented. What would your response be if this was your data?

As the discussion progressed, it became clear why the number of hours spent idling was what it was:

Admittedly, no one was tracking the number of idling hours that were attributable to any of those 4 points, but there was little argument that loading and rinsing contributed the largest share to the number of idle hours.

What can be done with this information? Since this sprayer is on a lease contract, the “cost per hour” is very easy to calculate. Now that we know the cost per hour of running this sprayer, we know how much all that idling costs. Now let’s go back to those 3 potential responses to first seeing this original data:

What this client of mine is now doing is evaluating the cost/benefit of putting a chem-injector system on their sprayer. Such an addition will:

To truly test this option, we would need accurate data over the period of at least 2-3 growing seasons measuring:

Naturally, very few, if any, farms record this data. Yet we can clearly see the effectiveness of having such useful information available to make the most informed decision possible. Without it, we are using emotion and our best guess. Obviously, our best guess can be way off, as is seen in just how much this sprayer spent idling in 2015.

Direct Questions

How are you managing and using your business data?

If you are not measuring it, and therefore cannot manage it, what are you using to make business decisions if accurate and useable data is not available?

How many decisions relating to improving efficiency can be made on your farm with better data?

From the Home Quarter

The report that contained this information (including the pie chart above) provides much greater detail to the goings on of that one machine than just usage by hour. Some of it, like the 8,970,000 yards this sprayer has traveled is not necessarily useful, but knowing that the 92.2hrs spent in transport used 910 gallons of fuel is.

While laughing and pointing around the table when comparing similar data from the combines, and identifying “who is the best combine operator” is interesting and fun, it is the action that comes out of the data that has the greatest impact. Positive action can and will impact your bottom line…but then so will inaction.

analyzing finances at the bin

Using Your Financial Information

Last week, we described how compiling your financial information will be beneficial to you in being able to analyze your previous year’s results so as to equip yourself in making informed decisions in the current, and future, years. This week, we discuss how to use that info.

Critical Balance Sheet Metrics

  1. Your Current Assets should be greater than your Current Liabilities by an amount that at least matches your cost to put in next year’s crop.
    Ideally, the difference between current assets and current liabilities should at minimum match your entire costs to run your farm for one year.
  2. You want your Total Liabilities to be no more than your 125% of your equity after net worth adjustments have been made.
  3. ROE is an acronym for Return On Equity. It is your net income divided by your net equity. Are you happy with the returns you’ve earned in each of the last 5 years?

Critical Income Statement Metrics

  1. First and foremost, is your Income Statement accrued? You can tell if you find an adjustment, up or down, to your income that would be labelled “inventory adjustment.” If your income statement is not accrued, call me for a quick description on how to do it yourself. It’s easy.
    Accruing your income statement is the only way to truly measure your profitability from the crop produced in a specific year.
  2. Did you have a profit? EBITDA (Earnings Before Interest Taxes Depreciation & Amortization) is a very important figure to know. It represents your profitability from operations; it shows you can generate profits. The calculation is Net Income + Interest Paid + Taxes Paid + Depreciation Expensed.
  3. Now that you’ve got EBITDA calculated, divide it by the following figures: Current Portion of Long Term Debt (found on balance sheet) + ALL interest paid (found on income statement) + ALL lease payments made (found on income statement). This is an important indicator for your lenders. This figure indicates to them your capacity to meet your financing obligations.

Critical Cash Flow Statement Metrics

  1. Cash Flow from Operations divided by Gross Sales indicates how many dollars in cash your business generates from every dollar in sales. The higher the figure, the better.
  2. Cash Flow from Operations divided by your “Property, Plant & Equipment” indicates how well your business uses its hard assets to generate cash.
  3. Cash from Financing divided by Cash from Operations indicates how dependent your business is on financing. The higher the figure, the more dependent on external money.

Solvency Calculations

Liquidity Calculations

Liabilities / net worth current assets / current liabilities
EBITDA / loan payments, interest & leases current assets – current liabilities


Direct Questions

Does the thought of doing such calculations overwhelm you, scare you, or just plain bore you? If the urgency of knowing these numbers doesn’t strike urgency into you, are you willing to ask for help?

How would you describe the benefit to your decision making if these figures were readily available?

From the Home Quarter

The comment has been made time and time again: “It’s easy to make money in the good times.” With tighter margins of late, more attention than ever before is being paid to management and finances. These calculations above are only a few of the measurements that you can take to gauge your financial strength or weakness.

And if you need a hand figuring out what to do next, contact me any time.