Posts

Recession Readiness

Recession Readiness

Recessions happen. In cyclical industries, the effect of a recession on a business’ results is magnified similar to how the benefits of a market boom are magnified. Industries that are less cyclical do not experience such swings in results and therefore appear to be more stable. These industries are less elastic (think about grocery stores, gas stations, natural gas companies) and are even considered “recession proof.”

If your business isn’t recession proof, here are a few tips to help you mitigate the effects of a recession and survive the downturn…maybe even thrive during it.

Bullet Proof Your Balance Sheet 

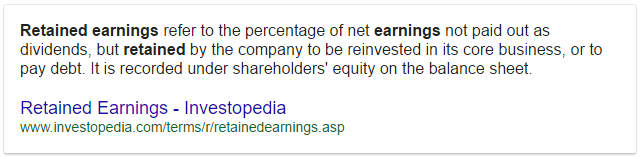
A strong balance sheet is your best weapon in fighting the effects of a recession. This also means keeping balance in the balance sheet, specifically top vs bottom, not just (left side and right side) assets vs liabilities. Top vs bottom means focusing on current assets and current liabilities (I.E. your working capital -the top half of the balance sheet), and not just accumulating assets and equity (the bottom half of the balance sheet.) Too often, I’ve seen businesses punish their working capital in a race to retire long term debt. While creating that equity by reducing debt is great, if it costs you your strength in working capital, it isn’t making your balance sheet bullet proof. Bullet proof is strong equity AND abundant working capital.

“Bullet proof your balance sheet during the good times, so you can catapult ahead of your competitors during the bad times.
If you get greedy during the good times, you’ll likely be on your knees in the bad times.”
– Moe Russell

Trim the Fat

Where in your business have things gotten a little complacent? Where is your business over-equipped? What can be identified in your business as “nice to have” instead of “need to have”?
When business is good it becomes easy to let things slide, to acquire equipment that helps things along but isn’t necessary overall, to treat oneself in ways that weren’t affordable before. It’s human nature, it happens, but it’s not sustainable in business that faces recession.

It is the business owner’s/manager’s obligation to scrutinize assets and processes for opportunities to get lean. And getting lean BEFORE the recession, before the business is forced to make reductions, is far easier than when the situation has become dire.

Is making a change to diet and exercise easier and more beneficial before a heart attack (I.E. prevention) or after (I.E. recovery)?

Be Responsive

We’ve all heard it before, and have probably said it a time or two ourselves: things will get better, they’ll turn around, just give it time.

Famous last words?

No one can accurately and consistently predict how long the market cycles will last. Many think they can, but they can’t. So if your business generates results that do not meet expectations, doing nothing about it is sure to repeat the same results. How long can your business not meet expectations during a recession? If we knew how long the recession would last, we could answer that question confidently, but we already acknowledged our inability to prognosticate market cycle duration. The solution then becomes, “do something about it.”

If revenue was below target, find out why.
If profit missed expectations, find out why.
If your best employees have resigned unexpectedly, find out why.
Waiting for divine intervention to “turn things around” is rarely a successful plan.

Plan for Prosperity

The advice above does not only apply to preparing for an economic or market recession; it applies to big picture planning in your business as well. Because it doesn’t take macroeconomic factors to have an impact on your business, putting these actions in play anytime will prepare you and your business for the unforeseen hazards that can throw your best laid plans into the ditch.

If you want to “Be Better™” is starts with “being ready.”

KYN Know Your Numbers

KYN: Asset Turnover

In this edition of KYN: Know Your Numbers™

The Asset Turnover Ratio is one of my favorite metrics, especially when working with farm businesses. Despite what one may infer by the name, this ratio is not a promotion of turning over assets any faster than they already are. Quick turnover of assets is a major contributor to profitability challenges and cash flow challenges in the farm space.

In brief, the Asset Turnover Ratio is a measurement of how efficiently a business uses its assets to generate revenue. The calculation indicates how many dollars in revenue are generated by each dollar invested in assets. Higher is better.

The classic (textbook) version of the calculation is “Total Revenue” divided by “Average Total Assets.” So if your business generates $2.5million in revenue with $1million in average total assets, then your Asset Turnover Ration (ATR) is 2.5:1.0 (or for simplicity, just 2.5).

Here’s what I don’t like about Asset Turnover Ratio:

  • It uses “average” total assets. I have never liked using average; I feel “average” is way to make substandard performance look acceptable.
    But more to this case specifically, how do we “average” the total assets in your business? If you just take the total at the beginning and the end of the year and average those two figures, you will get an “average,” but how accurate is it? Should we be measuring assets each month and average 12 measurements? What about assets that are acquired then disposed of very quickly between measurement strike dates? I’m not a fan of average.
  • There is no clarity between which value to use when measuring assets (I.E. market value or book value)
  • The calculation does not, by definition, include leased assets (leasing has become quite popular.)
  • To be truly meaningful we must recognize that each industry has different Asset Turnover Ratios that are considered acceptable; sometimes the differences exist even within a similar space. Consider retailing: online retailers would have significantly lower investment in assets than retailers with brick & mortar store fronts. Online retailers would have significantly stronger ATR accordingly.

Once we clarify how we will approach the Asset Turnover Ratio, and maintain consistency in that approach so as to accurately trend your ATR metric over time, the ATR becomes a strong indicator of your business’ efficiency.

  1. Determine how you will value your assets:
    – when will you measure the asset values (frequency, date(s), etc.)
    – eliminate confusion and ambiguity…do two calculations, 1 with market value of assets, and 1 with book value
    – do not exclude assets under a capital lease, it will provide a false positive. Assets under a true “operating lease” can be excluded.
  2. Understand how your ATR applies to your industry. If there is a deviation in your results versus industry, is it stronger or weaker; what is causing it?

What I like about Asset Turnover Ratio:

  • it creates a stark illustration of how well a business utilizes its assets (which is a MAJOR draw on capital)
  • it is a key driver of ROA (Return on Assets – a KEY profitability ratio) and OPM (Operating Profit Margin – a KEY efficiency ratio) both of which need to be monitored closely
  • it shows the DOWNSIDE of asset accumulation (which, in the farm space, is a difficult conversation.)

Trending performed over many years by advisors with experience durations that are multiples of my own suggest that grain farms and cow/calf operations have ATR in the range of 0.33 to 0.17. Feedlots and dairies typically range from 1.0 to 0.5. User beware: these measurements are using the classical textbook definition.

Plan for Prosperity

As with any financial ratio, evaluating only one ratio does not tell the whole story. As with any financial analysis, how the numbers are quantified will have a profound effect on the results. This is not permission to ignore these important financial indicators, but more so a call to action to understand how each one affects your business so that you can make the informed decisions that will lead to profitable growth.

Not understanding the factors that affect your business is no excuse to ignore them…especially when they are within your control.

KYN Know Your Numbers

KYN: Debt Ratio

You have probably been told that knowing your numbers is critical to your business management success. Truer words are rarely spoken. However, it is not lost on me that there are A LOT of numbers at play, and numerous measurements you can take…it is easy to become overwhelmed! The question then begs, “Which numbers are the important ones to know?”

If you are in business, you have heard about KYC: Know Your Customer. Well this is “KYN: Know Your Numbers™” and we begin with the Debt Ratio.

The Debt Ratio (also known as Debt to Asset Ratio) is a leverage ratio, meaning it is a measurement of the debt your business holds. The calculation is “Total Liabilities divided by Total Assets” and the result of the calculation tells you how much of your assets is financed. For example, if you have $5million in total liabilities and $10million in assets, your Debt Ratio is 0.5 : 1 (or just 0.5 for simplicity.)

Each industry has a “comfort zone” for where a debt ratio should be. This comfort zone is also flexible (to an extent) depending on where you are in your business’ life cycle. Knowing what the comfort zone is for the industry in which you operate is important.

Why I am Cautious About the Debt Ratio

  1. Because it lends itself to subjective information. Here is what I mean: when buying something, we want the price to be lower; when selling something, we want the price to be higher. While compiling the value of all your assets (a “selling” mindset) it is easy to value what you have at a premium, because A) it is yours, B) you love it, and C) you want to show that it was a good decision to acquire it.
    If the value of business assets is “padded,” then the calculation presents a skewed result to the positive.
  2. Off Balance Sheet Items. Over my 15 years as a lender and business adviser, I couldn’t even count the number of “off balance sheet items” I have had to discover. Whether it be trade credit from a vendor (which would lower the total liabilities), leases and leased equipment (which lowers both the total assets and total liabilities), or “forgotten” accounts payable (which, again, lowers total liabilities), the figures that somehow do not get included in the calculation can lead to a profoundly different result
    If the value of the liabilities is incomplete, then the calculation presents a skewed result to the positive.
  3. Appreciation of asset values “support” increasing levels of debt. Assets that have experienced an appreciation in value (such as real estate or quota) will lower the Debt Ratio with all other things being equal. This can provide an false sense of security to then take on more debt because “the debt ratio is strong and improving.” This is especially dangerous when the new debt is short term/operating debt. Should the value of those assets decline, there will quickly be pressure put onto the business by creditors.

These examples are not to suggest that there is malicious intent when providing information to do this ratio, but merely to draw attention to a subconscious behavior that is affected by emotion.

Plan for Prosperity

Knowing your numbers is critical, but only looking at current numbers may not tell you enough. What has been the trend of your debt levels, your assets values, and subsequently your debt to asset ratio? What has led to the changes in your asset values? Was it asset appreciation? Do your assets now include far more depreciating assets than before? What has led to the change in your liabilities? Was it debt paydown, or new long term debt? Was it additional short term debt/operating debt? Are your current liabilities making up a greater portion of your total liabilities than 5 years ago (or 10 years ago?)

In the next KYN commentary, we will discuss the trend of short term liabilities & long term liabilities, and how it affects Debt Structure.

Bubbles2

Bubbles

One of my investment advisers forwarded an article to me recently that contained an especially compelling paragraph. The entire article is US focused, penned by a US writer and published in a US publication (reprinted in Canada in the Financial Post.) Still, the applications of these two sentences are broad and deep:

“…it (recent economic growth) is driven by another round of financial engineering that converts equity into debt. It sacrifices future growth for present consumption.”

– Steven Pearlstein, June 15, 2018

The comparison was being made to the US housing crash that kicked off the global financial crisis in 2008. We all know what happened there; no need to rehash it here.

Yet here we are, barely 10 years later, standing at what some people feel is the precipice of another recession.

“Those who cannot remember the past are condemned to repeat it.”

– George Santayana (Ref.)

The statement from Pearlstein referenced above does have application locally: the recent rapid appreciation of farmland has provided a financial backstop to farm businesses that would have otherwise found themselves painted into a very tight corner. The present consumption, elevated operation costs and living costs driven by high priced equipment and higher living standards, is what, in this space, is leading to the sacrifice of future growth. Here is what I mean…

Les Henry recently penned an article titled Saskatchewan Farm Income and Land Prices which was published in Grainews. He compares farm income and land prices having converted both to 2018 dollars to quantify his position. An example Henry uses in the article describes how a friend of his purchased a brand new loaded Lincoln in the mid-1070’s and how the equivalent number of bushels of wheat, the staple crop in those days, was approximately 1,500 bushels needed to purchase that car. My dad used to make the same argument using the example of the only new tractor he ever bought: a 1974 CASE 970 that arrived in the yard with the plastic still on the seat. The qualifying statement was that it only required 2,870 bushels of wheat in 1974 to buy it; about 7 bushels per acre on his small farm. What does 7 bushels of wheat get you today on your farm?

Les Henry believes that current land prices are unsustainable. If he is correct, then we are almost certain to experience a bubble, even if it is a small one simply because of the amount of “equity” being used to backstop present consumption. Equity is in quotes because it was not earned equity from retaining profits in a business, but rather windfall equity from land value appreciation (similar to what set off the US housing crisis.) The rise in land values created the equity that, in many cases, has been turned into debt. Should land values pull back, lenders will be quickly re-evaluating their security and making some difficult phone calls where warranted.

If there is a bubble happening here, all that “equity” that was converted to debt has certainly helped create it.

Plan for Prosperity

We have dedicated a lot of space to discussions on growth here recently. It saddens me to think that future growth may have been sacrificed for current consumption. However, unless the wolves are near the door there is still opportunity to right the ship. Profit opportunities can be found, but it will take work, intention, and likely having to answer some uncomfortable questions.

The last five weeks we have discussed business cycles, elasticity of demand, the power of a network, intentionality in your business, and your vision in your business. It is no surprise that each of these topics, if parlayed into tangible action within your business, translate into a stronger entity that would likely provide a view from high on “success mountain” looking from a safe vantage point well above the “precipice of economic recession.”

If you want some ideas on how to climb higher up onto Success Mountain, please call or email.


balance sheet

Balanced View of the Balance Sheet

Like any piece of business information, the balance sheet is only as useful as the quality and accuracy of the information presented in it. In my experience, the balance sheet either gets too much emphasis or not enough. Too much when a business is not profitable, but always falls back on “Well we (they) have strong equity.” Too little when a young business is in high growth phase and is focused on nothing more than the next expansion opportunity, usually at all costs.

The construction of a balance sheet is quite simple: assets on the left, liabilities plus owner’s equity on the right. As the name implies, the two sides must balance. So when liabilities are greater than the assets, there is negative equity. Yes, you can have negative equity, but not for long unless you have an incredibly patient banker.

When describing the instances above where the balance sheet gets too much emphasis, the focus is clearly on the bottom half of the balance sheet, specifically the long term assets & long term liabilities and the owner’s equity. The equity is usually provided by appreciation of long term business assets, and if the equity is built almost solely on that and not retained earnings (net profit from operations) then there is definitely too much emphasis put on the bottom half of the balance sheet, namely equity.

The top half of the balance sheet is where most of the trouble starts. The top half is where we find the current assets and current liabilities; the difference between the two is working capital. Current liabilities have grown to dangerous levels from ever increasing loan and lease payments, cash advances, and trade credit. When current liabilities exceed current assets, you have negative working capital.

If your balance sheet has negative equity and negative working capital, you are the definition of insolvent, and the next phone you make is likely 1-800-AUCTION.

Ok, so there is equity on your balance sheet, more than enough to cover off the negative working capital. A patient and understanding lender might be willing to help you tap into that equity to “recapitalize” the business.  Do that once if you need to. By the time you’ve gone to that well two or three times, you’re likely closer to needing the classifieds to find a job rather than the next deal on equipment.

Equity doesn’t pay bills. Cash does.

Why punish your cash and working capital by rushing debt repayment to create equity?

Plan for Prosperity

The next time you catch yourself, or anyone else for that matter, leaning hard on the bottom of the balance sheet, namely the equity portion, think long and hard about why the focus is not balanced between the top half and bottom half of the balance sheet.

Not only do the left and right sides of the balance sheet need to balance, but so does the top and bottom.

Return on Assets

ROA (Return on Assets)

Return on assets, or “ROA” as we’ll refer to it, is an often overlooked financial metric on the farm. Partly, I think it is because there is a culture in agriculture that places too much emphasis, even “romanticizes” the accumulation of assets (namely land, but mostly equipment.) This doesn’t necessarily bode well for ROA calculations. But the greater reason ROA isn’t a regular discussion on the farm, in my experience, is because it is not understood.

return on assets formula

The math is simple to understand, so when I say “ROA is not understood,” I mean that the significance of ROA, and its impact, is not appreciated.

Return on Assets is a profitability measure. Its key drivers are operating profit margin and the “asset turnover ratio.” ROA should be greater than the cost of borrowed capital.

Let’s ask the question: “When calculating ROA, do we use market value or cost basis of assets in the denominator?” The simple answer is “BOTH!”
Do two calculations:
1) using “cost” to measure actual operational performance;
2) using market value to measure “opportunity analysis” which is a nice way of saying “could you invest in other assets that might generate a better return than your farm assets?”

Operating profit margin is calculated as net farm income divided gross farm revenue, and is a key driver of Return on Assets.

The asset turnover ratio (also a key driver of ROA) measures how efficiently a business’ assets are being used to generate revenue. It is calculated as total revenue divided by total assets. The crux of this measurement is that it has a way of showing the downside of asset accumulation. The results of this calculation illustrate how many dollars in revenue your business generates for every dollar invested in assets. While there is no clear benchmark for this metric, I’ve heard farm advisors with over 3 decades experience share figures that range from 0.25 to 0.50. This means that for every dollar of investment in assets, the business generates 25-50 cents of revenue (NOTE, that is REVENUE not PROFIT).

If assets increase and revenue does not, the asset turnover figure trends negatively.
If revenue increases and profit does not, the operating profit margin trends negatively.
Increasing revenue alone will not positively affect ROA. “Getting bigger” or “producing more” alone without increasing profit does not make a difference. If you recall: “Better is better before bigger is better…”

To Plan for Prosperity

As you will find in many of these regular commentaries, the financial measurements described within are each but one of many practical tools to be used in the analysis of your business. Return on Assets cannot be used on its own to determine the strength or weakness of your operation. But used in combination with other key metrics, we can determine where the hot issues are, and how to fix them so that your business can maximize efficiency, cash flow, and profitability.

Per Acre Equipment Investment

Per Acre Equipment Calculation

In the June 8, 2017 edition of the Western Producer, columnist Kevin Hursh penned Per acre equipment calculation can be revealing. As is typical, Hursh hits the nail on the head with this piece by suggesting farms should know their equipment investment per acre. His column goes on to describe how new equipment has seen significant increases in SRP (suggester retail price) over the last few years, contributing greatly to the elevating of the “per acre equipment calculation.”

First, let’s figure out where you are at. Add up the current value of all your equipment, owned and leased. If that total is $2.5million, and if your farm is 5,000 acres, your equipment investment per acre is $500. If we compare that to a 2,500 acre farm with $1million invested in equipment (therefore $400/ac), who is better off?

Measure it against earnings

Last year, I had a client tell me about a meeting with his lender. This particular client is small acreage, relatively speaking (under 1,000ac in crop) and yet was quite well equipped for his acres. He carried minimal debt, and despite some cash flow challenges over the previous two years, his working capital was still very strong. He was seeking a high-clearance sprayer so that he could ensure timely fungicide applications for his lentils, and other high value crops. The feedback he received from his lender was that his “equipment investment per acre was to high.” On the basis of that single calculation, it most certainly was. What the lender failed to evaluate was the entire farm profitability. Because of the small acre base, my client was able to produce a rotation of high-management high value crops. His net profit per acre was almost double a typical grain farm. His ability to justify a high equipment investment per acre was evident. Needless to say, he acquired his sprayer (a used model valued at just north of $100,000) pushing is equipment investment per acre from $484 to $644.

Let’s go back to the 2 fictional examples above.
EBITDA vs Per Acre Eq InvIf we only looked at equipment investment per acre, we would likely conclude that Farm B is in a better situation by only having $400/ac invested in equipment versus Farm A having $500/ac. Yet when we dig further by bringing EBITDA into the calculation (EBITDA is Earnings Before Interest Taxes Depreciation & Amortization) we discover that Farm A generates stronger EBITDA per acre than Farm B, and is therefore possibly justified in having a higher investment per acre in equipment. In practical applications, even this doesn’t go far enough to determine which is better, but it’s a start.

To Plan for Prosperity

Delving into management calculations can be daunting and confusing. If we don’t know what to look for, how it compares, or even if we’re not measuring anything, we’re already behind before getting started. Begin by measuring the many facets of your business; in this case, “What is your equipment investment per acre?” How has is changed over the last five to ten years?

Relating back to my client, his EBITDA was a whisker under $120/ac, so his EBITDA to Equipment Investment on a per acre basis was about 0.186:1. This means that with his equipment investment of $644/ac will generate about $0.186/ac in EBITDA. Is that a good metric? As Kevin Hursh closed his column, “It’s unfortunate that more information isn’t available on the typical investment levels in each region. That would allow producers to make more relevant comparisons.”

intimate with EBITDA

Be Intimate with EBITDA

No, not in the literal sense. This is a G-rated commentary…

EBITDA is an acronym for Earnings Before Interest Taxes Depreciation & Amortization. It is your business’ profit from operations. More than just understanding it, being intimate with how it affects your business is critically important.

EBITDA is pure because it does not include the effects of financing decisions (this is why is excludes interest,) accounting decisions (this is why it excludes depreciation & amortization,) and tax environments (this is why it excludes income taxes paid or payable.) It simply shows just how slick of an operator you really are.

ebitda calculation

If your accountant isn’t including this in your financial statements, you can figure it out pretty easily using the formula above. How has your EBITDA been trending over the last 5 years? Have you considered the reason why?

Your lender is keenly interested in your EBITDA. In fact, he or she will calculate it internally and measure it against your total debt payments required in the next 12 months. It is called “debt service coverage” or DSC for short, and is a deal breaker if it doesn’t meet your lenders’ minimum standards.

For many farms, net equity has been on a very positive trend over the last several years. While this is good news, like any news we can’t just take it at face value. What is the underlying story? If equity has been increasing from appreciation of asset values (namely land) and not from retained earnings, then it does not build confidence that the operation is profitable. If the operation is profitable, it is capable of growth and meeting loan repayment schedules (those same loans that help fund the growth.)

retained earnings

If a business is not retaining any earnings within the business, it limits its ability to fund growth, transition, etc.

To Plan for Prosperity

Recognize that EBITDA is the measure of your business’ operating performance. It has a key accountability in growing your business’ net equity. It is heavily relied upon by lenders.

  1. Calculate your EBITDA. Look at how it is trending. Acknowledge what it affecting the trend.
  2. Understand your lender’s debt service coverage (DSC) calculations.
  3. Decipher what has had the greatest inpact on your net equity: appreciation of assets, retained earnings, or both?

Your relationship with your EBITDA should be very, very close; some might even say “intimate.”


inadequate working capital

Eat to Live, or Live to Eat

This week’s title is common phrasing when dealing with people who struggle with weight loss. While there are many factors that come into play for those who struggle with weight, a person’s caloric intake is often a major contributor. Making smart decisions about what to eat, when to eat, and how much to eat can be challenging for many people who are trying to do a better job of managing their health, not just those with weight issues. The question of “why” they eat gets into the psychology of the issue, which, coincidentally, leads into the real topic behind this week’s commentary.

Spending time at Canada’s Farm Progress Show in Regina each June has been something I’ve looked forward to for as long as I can recall. Remember, I knew I wanted to farm since I was less than 10 years old, so the Farm Progress Show was a more tantalizing buffet to the teenage me than even an actual buffet! (BTW, I still have an appetite like an 18 year old farm boy.)

The desire for more and new farm equipment seems almost insatiable, and begs the question:

Do we have all this equipment so we can farm, or do we farm so we can have all this equipment?

  • I recently met a young farmer who, while struggling to establish adequate cash flow, explained why another 4WD tractor on his 2,000ac farm will make him more efficient (he’s a sole operator with no hired help…how one man can drive more than one tractor at one time is something I can’t quite wrap my ahead around.)
  • You may recall from a few months ago the fictional story about “Fred” and how he NEEDED another combine. Despite his banker’s advice, he forged ahead.
  • Conversely, another farmer I speak with frequently is feverishly trying to rid himself of the over-abundance of iron on his farm.
  • Another is protecting his farm’s financial position by keeping the absolute bare minimum amount of equipment on his farm. Nowhere is there a “nice to have” piece of equipment on that farm; everything is “fully utilized.”

During the week of the June show in Regina, I read a tweet from an urban, non-farming young lady who was seeing the Farm Progress Show for the first time; it said (something along the lines of) “all this big beautiful equipment makes me want to go farming!”

Direct Questions

What circumstances must be present for you to consider additional equipment?

Does any equipment deal have to make for a sound business decision, or simply fill a desire?

Is your equipment a tool to operate your farm, or is it the reason you farm?

From the Home Quarter

In these weekly editorials, you have read about Mindset, about Strategy, and about Focus; these topics (and many of the others) challenge the conventional thinking in the industry today.

Those who bow to the mistress that is their farm equipment are only enjoying short term excitement. The mistress entices her suitor, subservient to the raucous cycle, and she soon becomes the one in charge.

Just ask anyone trying to get out of multiple leases…

cash is not king

Cash Isn’t King

I think this phrase has gained such popularity because of alliteration. The hard “c” in cash just rolls with the word “king.”

Let me emphatically disagree with the ideology that cash is king.

One could argue that the king rules all, answers to no one, and has absolute power. While I’m sure that is what the king would have everyone believe, the truth is that kings have always been influenced by the likes of his queen, his advisors, other diplomats, etc. Is he, then, truly the top, unflappable, incontestable?

Since we live in a democracy and are no longer ruled by a king or queen, when I hear such terms I think of cards. The card games I enjoy the most are 3-Spot (also known as Kaiser) and Poker. In both games, the king is soundly trounced by one card that is even greater.

Yes, I’m saying it.

Cash is not King.

It’s the ACE!

If cash is king, then that means that something else is the Ace, something else is more important than cash. This is simply not so.

Cash is the ace, the pinnacle, the life blood of your farm.

Imagine how the decisions would be different, the decisions that are made every day and every year on your farm, imagine how they would be different if you had an abundance of cash:

  • Instead of gambling on trying to time the commodity market high, you could sell your production whenever was most convenient and/or at an appropriate profit point.
  • You would cease the need for operating credit, vendor credit, or cash advances.
  • “Cash management” would no longer be juggling between various creditors and hoping you can deliver grain in time to make payments, but instead it would be paying bills on time (ahead of time?) and selling grain when it made the most sense.
  • Risk management programs would be a non-issue.
  • Equity loans to recapitalize the business would be a completely foreign concept.
  • Acquisition decisions (land, buildings, equipment) would be easier, faster, and more empowering.
  • YOU’D HAVE LESS STRESS!
    (That is capitalized for a reason.)

Cash is the Ace. It ranks above precision planting, Group 2 resistance, or the latest technology trends. The Ace outranks the King; it outranks all the other cards.

Direct Questions

Has cash always been your Ace, or have other things become more important?

What are the top three benefits to you and your business if cash was abundant?

How confident would you be to have TWO Aces in your hand?

From the Home Quarter

We often regard agriculture as doing amazing things with scare resources. Cash does not have to be one of those scarce resources even though that has been the mantra for generations (a.k.a Asset Rich – Cash Poor). Assets do not pay bills, cash does. The desire to convert cash into assets needs to be squelched at a time when debts are high, cash flow is tight, and profit margins are narrow.

Since cash is the life blood of your business, and a critical contributor to your financial health, when is the last time you had a checkup?

With your year-end financial statements now done, you’re ready for a checkup. Email your financial statements to me and I’ll provide you with a financial health report card. Normally a $500 value, this service is free if booked by June 13, 2016.