
Managing Operating Efficiency
“You can’t manage what you don’t measure.” It’s been said time and time again, by me and many others. Here is an example that should get everyone buzzing.
A client of mine recently shared a sample of information that they collected from their equipment. The information shared with you is specifically from their sprayer:
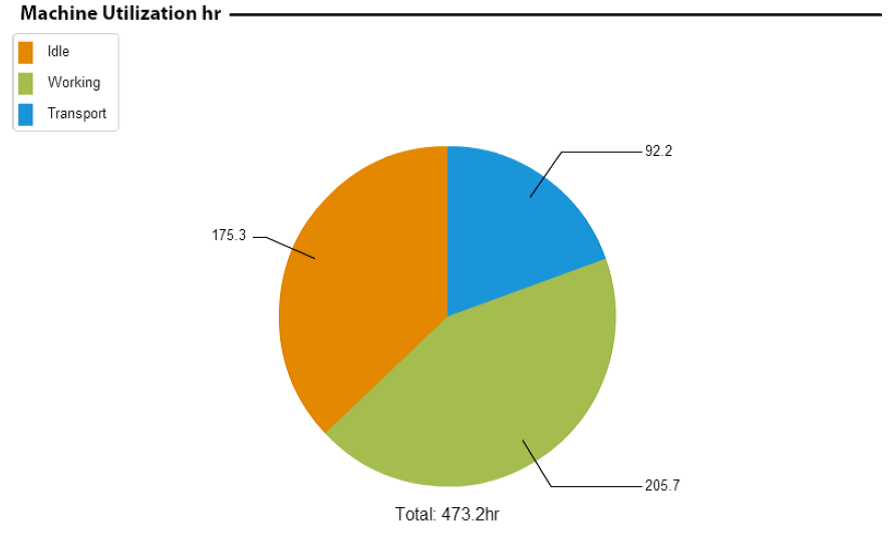
A simple pie chart creates an “A-Ha Moment” that no one saw coming. I am sure you can all imagine the conversation around the table when this information was presented. What would your response be if this was your data?
As the discussion progressed, it became clear why the number of hours spent idling was what it was:
Admittedly, no one was tracking the number of idling hours that were attributable to any of those 4 points, but there was little argument that loading and rinsing contributed the largest share to the number of idle hours.
What can be done with this information? Since this sprayer is on a lease contract, the “cost per hour” is very easy to calculate. Now that we know the cost per hour of running this sprayer, we know how much all that idling costs. Now let’s go back to those 3 potential responses to first seeing this original data:
What this client of mine is now doing is evaluating the cost/benefit of putting a chem-injector system on their sprayer. Such an addition will:
To truly test this option, we would need accurate data over the period of at least 2-3 growing seasons measuring:
Naturally, very few, if any, farms record this data. Yet we can clearly see the effectiveness of having such useful information available to make the most informed decision possible. Without it, we are using emotion and our best guess. Obviously, our best guess can be way off, as is seen in just how much this sprayer spent idling in 2015.
Direct Questions
How are you managing and using your business data?
If you are not measuring it, and therefore cannot manage it, what are you using to make business decisions if accurate and useable data is not available?
How many decisions relating to improving efficiency can be made on your farm with better data?
From the Home Quarter
The report that contained this information (including the pie chart above) provides much greater detail to the goings on of that one machine than just usage by hour. Some of it, like the 8,970,000 yards this sprayer has traveled is not necessarily useful, but knowing that the 92.2hrs spent in transport used 910 gallons of fuel is.
While laughing and pointing around the table when comparing similar data from the combines, and identifying “who is the best combine operator” is interesting and fun, it is the action that comes out of the data that has the greatest impact. Positive action can and will impact your bottom line…but then so will inaction.


Leave a Reply
Want to join the discussion?Feel free to contribute!