Posts

KYN Know Your Numbers

KYN: Profit Margin

“It’s not what you make, it’s what you keep!”

Prophetic words that apply to every business and simplifies the importance of profit.

Profit Margin is calculated as “Net Profit” divided by “Gross Revenue.” Essentially this calculation tells you how much of every dollar earned in gross revenue is actually profit. The smaller the profit margin, the less you keep.

It goes back over 10 years now to when I was a bank branch manager in a rural community. A client was trying to purchase a lake cottage and was upset with us that we weren’t clamoring to provide them with a mortgage. They worked very hard in their business that provided a service to the oilfield, and had expanded it several times by adding more trucks and employees. In one of their rants on me for not giving them what they wanted (it was more like “demanded” at this juncture) one of the partners (a married couple) said, “What does it take? We made a million dollars last year!” True, their top line revenue was exceeding $1,000,000 in the previous fiscal year; however, their net income – the profit – was just over $15,000. Even adding depreciation and interest back into the calculation (to arrive at EBITDA) there was no way they could service the mortgage they were requesting. Their profit margin was (in a simplified example) 0.015%, which meant that for every $1.00 in revenue they generated, they were retaining $0.015 in profits (1.5 cents profit for every dollar in revenue…hardly sustainable in a cyclical industry.)

What I Don’t Like About Profit Margin

  1. There are many variations on the calculation:
  • gross profit margin
  • operating margin
  • pretax profit margin
  • net margin…just to name a few. Each of these is measured slightly differently and has different meaning in different circumstances. If there isn’t sufficient care in assuring accurate nomenclature, things can get confusing.

2. The calculation, on face value, includes the non-cash depreciation expense (a tax figure) that often does not accurately portray the true market depreciation of an asset.

What I Do Like About Profit Margin

When calculated consistently over time, the trend will open up investigation and discussion on variances year over year (YoY) so that corrections can be made if necessary. I also like that it can be an internal benchmark, your own personal KPI (Key Performance Indicator) to which you could measure actual profit margin results against an ideal profit margin target that would fuel your business goals and growth aspirations.

Plan for Prosperity

What is a sufficient profit margin in your business? It is often relative to the industry in which you operate. If you have no idea, a good person to ask is your banker.

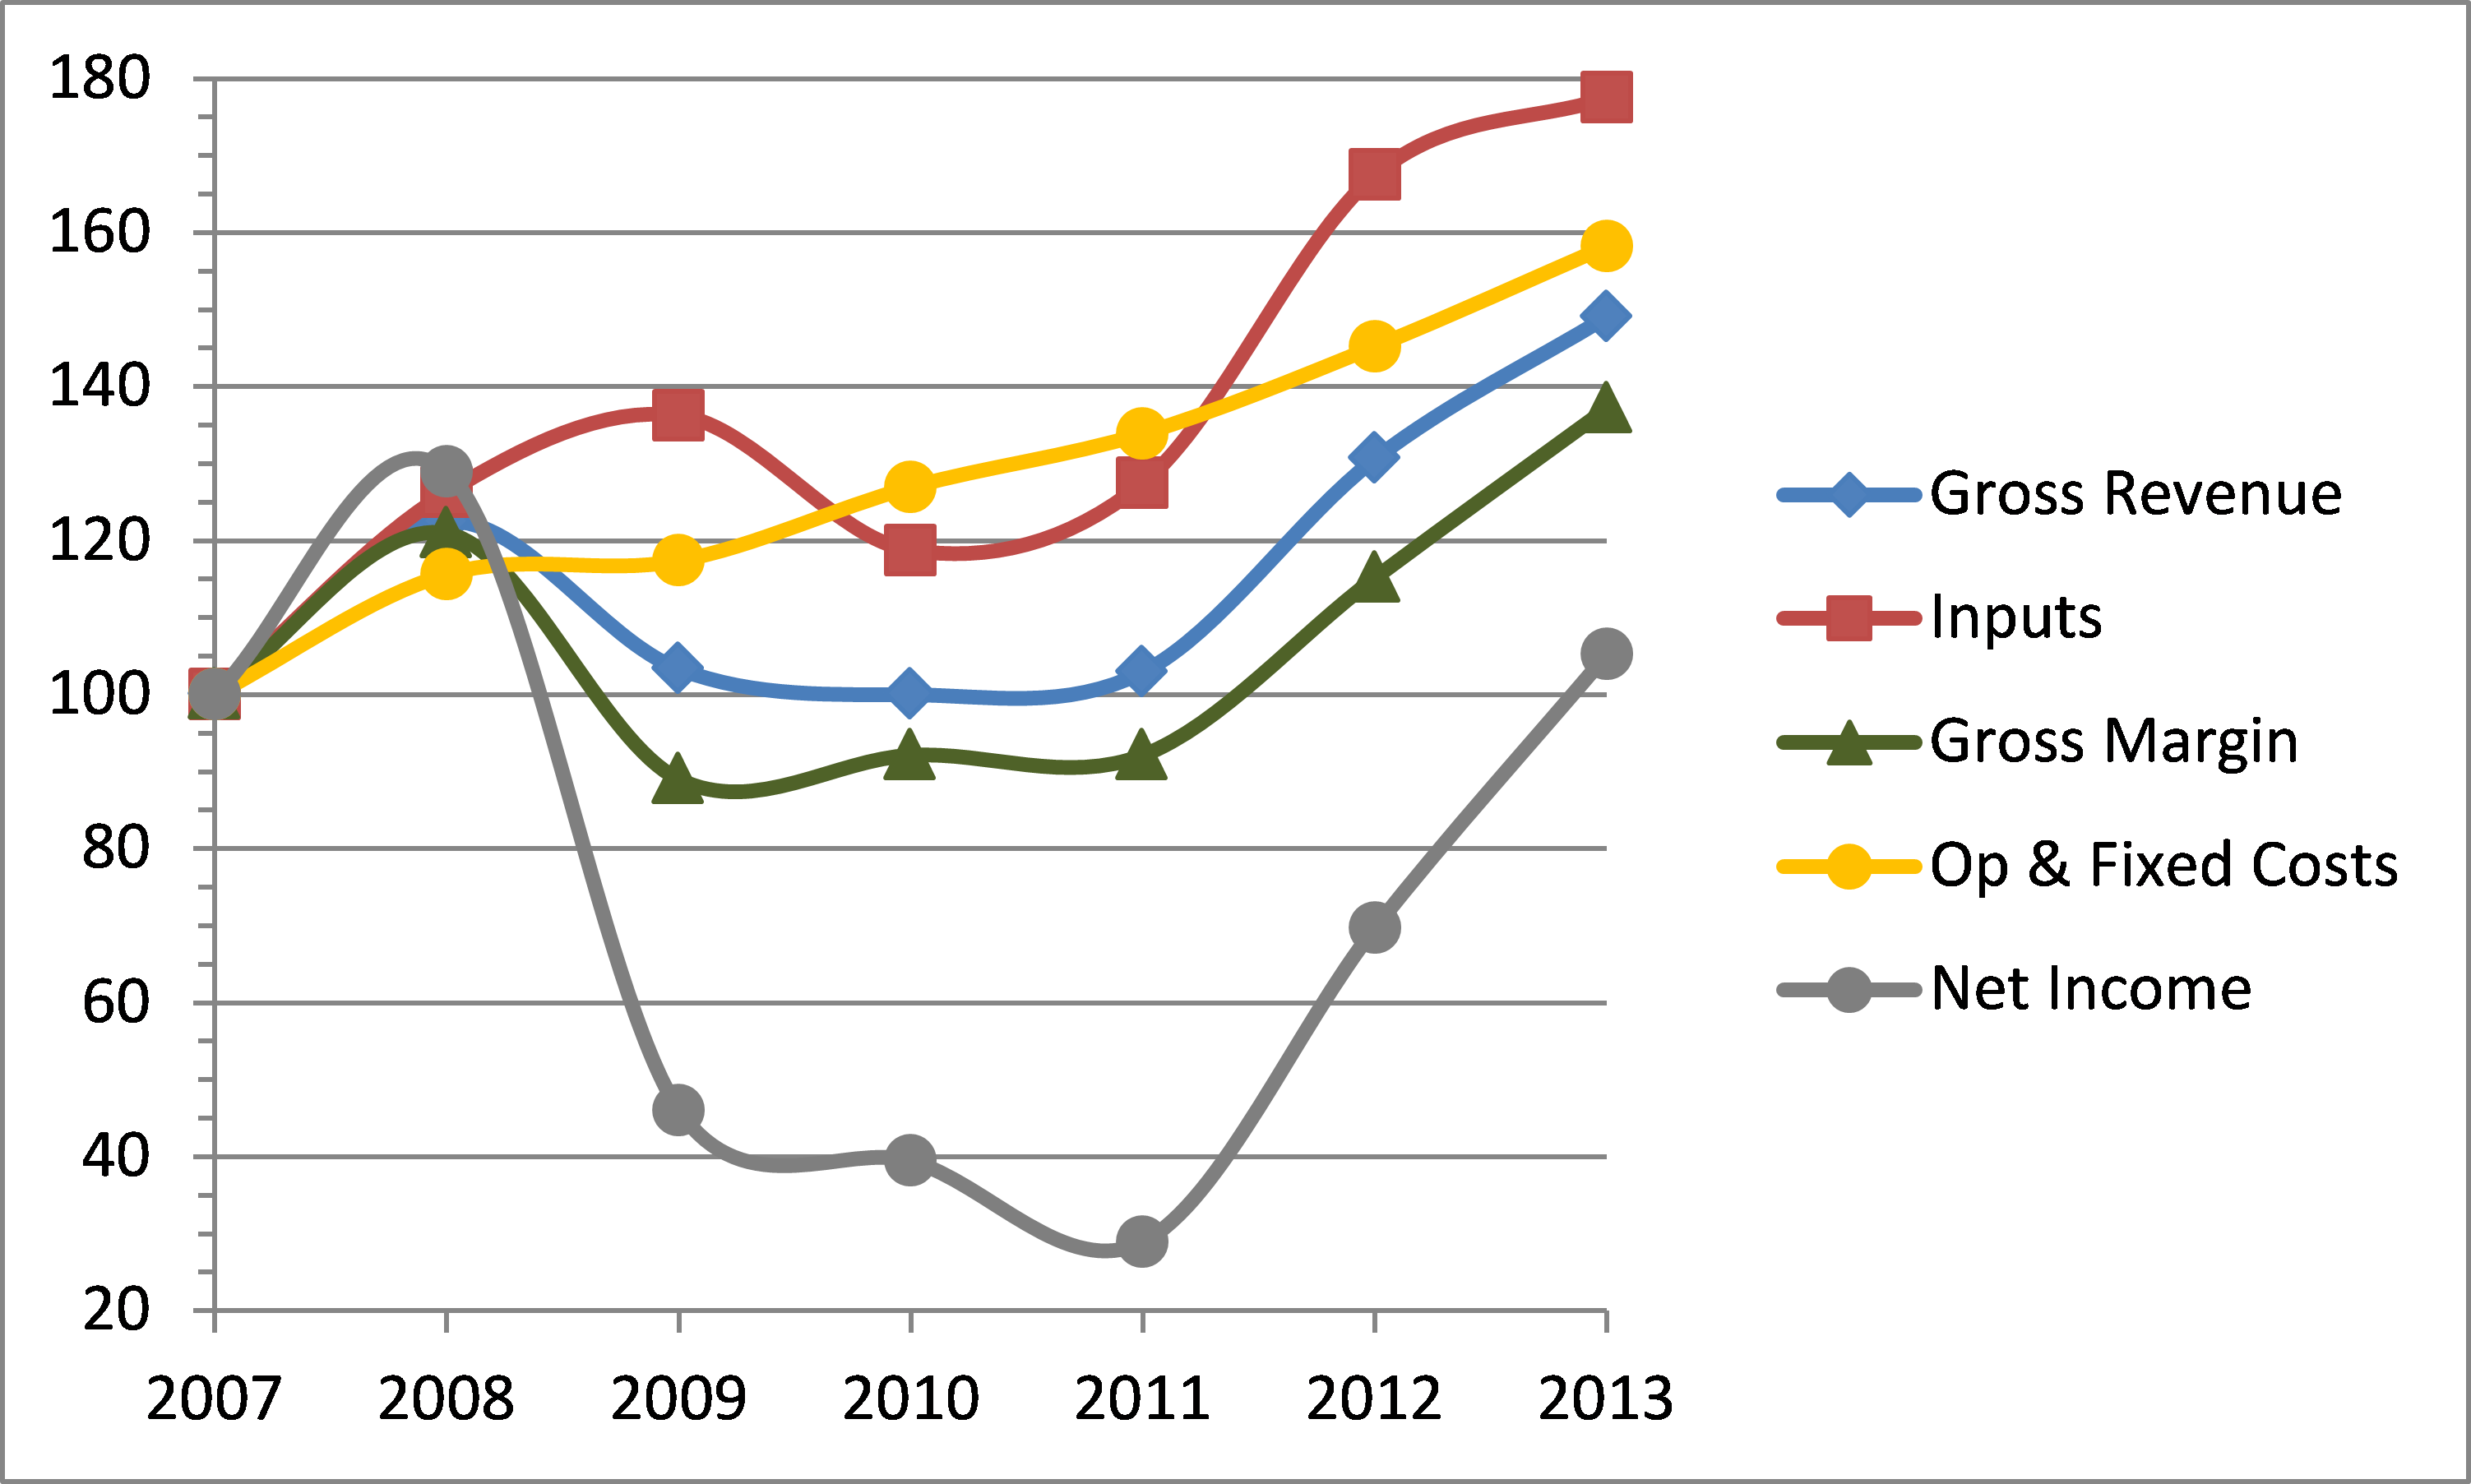
After spending virtually all of my professional career working on the financial and business aspects of agricultural production, I can confidently say that western Canadian grain farms need to target a 20% profit margin to sustain their businesses through the volatile cycles that affect the industry. “Target” because some years will blow right by 20%, other years will be low single digits (or negative numbers.) This truly is one space where bigger IS better!

Where has your profit margin measured out over the last 3-5 years? Which way is it trending? Why? If you don’t know the answers, or haven’t asked the questions, there is no time like right now to dig in.


marking a bench 4

Benchmark Against the Best

Who do you look up to? It doesn’t have to be another business like yours, it can be anyone or any business. Why do you look up to that person or entity? What have they done that you want to emulate?

“If you benchmark yourself against the average you’ll be out of business in 5 years.”

Dr. David Kohl

What Dr. Kohl is referring to is that “average” is not success. As one client said this past week, “Average is the best of the worst, or the worst of the best; either way it’s not where we want to be.”

Personally, I’ve never been a fan of using averages when analyzing business performance. The sample pool will skew the calculation up or down; extenuating circumstances create anomalies in year-over-year business results; the list could go on. In my opinion, average is a useful tool to make yourself feel better about where you’re at. I prefer to make clients uncomfortable about where they’re at so that they are motivated to “Be Better™”.

Here’s someone we all know about who is never not trying to be better: Warren Buffett. Now don’t get me wrong, I’m not suggesting the Oracle of Omaha is without flaw or that he is somehow worthy of unwavering praise, but it cannot be denied that his approach to building wealth has enjoyed success beyond most of our wildest dreams. Recent articles in the Financial Post indicate that Berkshire Hathaway is currently sitting on about $116 Billion in cash and other short term investments. This cash is sitting idle for the purposes of making acquisitions, but Buffett has admitted that he’s struggled to find acquisitions at sensible prices. Also, the article states that Buffett is unwilling to load up on debt to finance deals at current prices.

“We will stick with our simple guideline: The less the prudence with which others conduct their affairs, the greater the prudence with which we must conduct our own,”

Warren Buffett.

It has been written in this series of commentaries that during the elongated commodity super-cycle which ran from about 2007 to 2015 we could find many “average” businesses who appeared to be “excellent”. The appearance of excellence was fed by strong yields and high commodity prices. To translate: everybody was making money, even the worst managers and the high cost operators. To paraphrase Dr. Kohl: when the bottom 20% of producers become profitable, we’re in trouble! It didn’t take much prudence to be profitable during the boom; how did you compare during the boom? How do you compare now?

So when considering who you want to mirror, is it one who has been racking up debt balls-out on the expansion train or one who has been quietly amassing a war-chest of financial strength that can be deployed when the right opportunity presents? Is it one who operates with reckless abandon, or strategic execution? Is it someone who is average, or is it the cream of the crop?

Plan for Prosperity

Benchmarking data is hard to come by; not everyone is willing to share the details of their successes or failures. So to start, benchmark against yourself. How did your most recent year stack up against your best year ever? How do your 2018 expense projections compare to your 2003 expenses? What has been the 10 year trend of your working capital, EBITDA, net profit, total debt, and total equity? Is it something you’d be proud to share? Let me know; I’d love to hear from you on what you learned from this exercise.

push pull

Push and Pull

Push and pull.

Passive aggressive.

Proactive or reactive?

Okay, passive aggressive doesn’t REALLY apply…or does it?

A recent conversation with a banker had him using terms & phrases such as:

  • they have no idea what they owe, to whom, or what their payments are;
  • they leave out information in what they send to us;
  • after a year of battling over their lack of cash management, the bank is viewing their risk profile as ‘high.’
  • the promised to put together a plan months ago, but it seems there was always ‘something more important’ to do. Now that the bank is downgrading them, they’re in a hurry to get the plan in place.

The borrowers that this banker was speaking of have consistently displayed a behavior that is reactive. They:

  • only provide info to their lender when threatened;
  • do not follow the terms set out in their borrowing agreement;
  • only got serious about making a plan when the bank indicated that their credit risk profile was being downgraded.

Situations like this are, sadly, not uncommon. All too often, financial professionals see impending challenges and offer advice that is pertinent based on their experience. Whether the advice is heeded or ignored is out of our control.

What can be done? At risk of sounding like a broken record…

  1. Preserve cash by building strong working capital;
  2. Do not acquire capital assets with working capital…borrowing is still incredibly cheap!
  3. Drive down overhead costs so you can produce at the lowest Unit Cost of Production.

The challenge, of course, is now during a period of low commodity prices, how does one go about preserving cash to build working capital. A pessimist might say “that ship has sailed” with the end of the commodity boom. Notwithstanding any significant production issues somewhere on the globe, this may be true. And to bring it back around to the open of this commentary, proactive or reactive, it seems that by and large farms are reacting to the profitability challenges and positive cash flow challenges of the day. Proactive would have acknowledged that the good times were cyclical and would not last forever…

Plan for Prosperity

PUSH yields. In commodity production you need the bushels, but focus on optimum yield for profitability, not maximum yield for coffeeshop bragging rights!

PULL efficiency. You need to do more with less in low margin environments.

PUSH costs down. The lowest Unit Cost of Production (UnitCOP) wins. Period.

PULL management effectiveness to new heights. During times of questionable profitability, it is management that will rise to the top.


Rayglen 2018_2019 proj crop returns

The Great Profitability Challenge of 2018

The graphic seen above was shared at a recent CAFA chapter meeting (Canadian Association of Farm Advisors) and forwarded to me by one of my fellow CAFA colleagues who was in attendance. By coming from a reputable commodity trading entity, there is a level of trust we can have in the data presented.

And the (projected) data looks bleak.

With only four crops expecting a net profit to exceed $50 per acre by any respectable amount, the profitable options for 2018 are few and far between. No wonder the common sentiment this winter is “I don’t know what to grow this year; doesn’t look like anything will make a profit.”

Considering the four crops in the Rayglen projection that are close to abundantly profitable are 1 variety of chickpeas and 3 varieties of mustard, it’s pretty clear that your geography becomes part of your challenge. Yes, wheat, barley, flax and canola are also projected to be positive, but are any of them sufficient based on the risk and/or your personal circumstances on your farm?

Here are some questions that I feel must be asked:

  1. Is crop rotation holding you back from loading up on what few profitable options are available?
    I recently heard a lender suggest that those who blow up their crop plan to chase the perceived winner, by his account, usually miss out.
    This can be often true because of the long cash conversion cycle in production agriculture. Farmers bet on a crop plan that they expect will make them money, but a lot can happen between February and harvest…the market giveth and the market taketh away! If there is one thing Western Canadian grain farmers can do, it’s produce! We can overproduce a commodity in as little as one crop cycle, and as such in July or August drive down what was a winning price back in February!
    The lender referenced above went on to say that sticking to your proven crop plan is the way to hit a winner most years, maybe even multiple winners!
  2. Is $50 per acre or even $75 per acre net profit realistic, or even sufficient?
    How much was expected yield and/or price “padded” in that projection? How much were total costs “softened”? Were there 4-6 applications of fungicide built in to those chickpea projections?
    Generalist type of prognostications like this one need to be taken with more than just a grain of salt. Do the “variable” and “total” expenses displayed reflect your farm? What is included in each category? Are they including all expenses, including the PAPERCLIPS? There is much ambiguity in figures like these.
  3. Do whole farm expenses reflect the capability of the crop plan, or is the crop plan now expected to meet the ever-increasing farm expenses?
    Recently, I’ve overheard a couple of pundits suggest that whole farm expenses are now nearing $400 per acre. If true, that relegates many crop plans into the underworld of “operating loss.” I’ve gone on record several times suggesting that the elongated commodity boom recently ended has allowed many bad habits to form at the farmgate. The habits in question surround the insatiable appetite for newer/bigger farm equipment, larger land base, and higher living standards. It wasn’t long ago that top tier farmers kept their operating costs (described by some as labor, power, & equipment) in the range of $90-$100/ac, and these pundits now suggest that the best of the best are in the $140-$150/ac range. That $50/ac increase in what is the most controllable facet of farm expenses clearly has shaken the profitability potential to its core on many farms. And that only applies to those whose operating costs have increased by ONLY $50…

Plan for Prosperity

The recipe for profitability is simple:

  • Have a plan (how/why/what you do);
  • Run lean;
  • Know your numbers & market to your numbers;
  • Maintain discipline.

Of course, if it was as simple to do as it is to describe, everyone would simply do it. Also, did you notice that nowhere was there anything in that recipe about production or farm size? In the commodity business, the winner is the one who produces at the lowest cost per unit of production; the best way to achieve that is to have a plan and maintain discipline to it, get lean and stay that way, and finally market your production to your numbers (not to your emotion.) If you’re have challenges with any of the four ingredients in that recipe, why haven’t you picked up the phone and called for help already?


Average

Don’t Settle For Average

It was the headline that struck me.

Don't settle for average _embedded

Settling for average in any aspect of your business will lead to certain demise. If everything was average (yields, quality, market prices, rainfall, heat units, weed pressure, disease pressure, input prices, equipment repair frequency, wages, overhead, etc, etc, etc…you get the picture) then farming would be easy.

But it’s not.

Fair to say that if you are projecting average yields and prices for 2017 you’ll be measuring those against higher-than-average costs. This is likely to total down to a negative bottom line.

I’ve never been a fan of “average.” As my old friend Moe Russell likes to say, “You can drown in a river that averages a foot deep.”

Average, to me, is nothing more than a feel good guide when looking to validate poor results. For example, acknowledging that yields were only a couple bushels below average means nothing Table for Averagewithout quantifiers like market prices (meaning we’ve calculated gross revenue), like input cost (meaning we’ve calculated gross margin), or like operating costs (meaning we’ve calculated profits from operations.) Here is a table to illustrate what I’m getting at:

If average is profitable over the long term, then we must acknowledge the need to adjust all facets of our profit calculation when one facet is below average. The problem is that generally we are seeing farms operate with higher than “average” costs and trying to pay for them with “average” yields.

To Plan for Prosperity

Our profitability is not determined by where it falls on a bell-curve, so why would we accept “average?”


control-word-cloud

Control

Happy New Year! My wish for your 2017, as I’ve extended to everyone regularly so far, is “peace and prosperity.” That may have been fortuitous as this, the first weekly commentary of 2017, carries a new name: Pragmatic Prosperity™.
Prosperity is not only my hope for the entire agriculture industry, it is my goal for every business I work with. Pragmatic describes the advice, strategy, and solutions we bring to each engagement. We are very excited about this evolution in our branding.


How do you employ control in your business? Is it over operations, people, cash flow? Those are quite broad descriptors, and when it comes to people, please recognize the difference between control and influence.

Here are the top areas to control in 2017 to achieve greater prosperity.

  1. Cash
    Working capital, especially cash, is a critical component of any successful business. Over the life of this weekly blog, you’ve read my constant rant about improving working capital. More and more important, the piece of working capital that needs focus, will be cash. A big part of working capital is inventory, but in a time when it is all too common for inventory to fall subject to grading issues, delivery glitches, etc, farms need the stability that comes from increased cash on hand.Expenses and debts unabashedly punish your cash. What are you doing to protect it?
  2. Marketing
    Even though we’ve had (generally) another banner year on the crop side, we have to give credit to the insulation from the commodity slide that we’ve enjoyed thanks to our slumping Canadian Dollar. Should the dollar strengthen, we’ll feel more of the pinch that our American neighbors are living with today. How would your cash flow look if you had to manage today’s expenses with 2010 prices?
    Far too many farms rely only on forward contracts. The reasons for it, I won’t speculate. Many tools and advisors exist to help you control your marketing (versus letting your marketing control you.)  When you’ve got full control over operating expenses (Point #3 below…keep reading) your marketing opportunities become more clear. This allows you to confidently price profitably.
  3. Operating Costs
    When we make more, we spend more (despite a contrarian strategy discussed here on May 17, 2016 – Spending Less is More Valuable than Earning More.) As farm incomes rose, so did farm expenses; what used to be “nice to have but could live without” has now become “must have” (in mindset anyway.) If we are to compare 2017 expenses to 2010 income (as suggested above,) why not look at 2010 expenses too? How have operating costs changed in your business over the last 7 years (2010 to 2016 inclusive)?

To Plan for Prosperity

You’ll note that the first item listed, cash, is at the top for a reason. However, if you start at the bottom, you’ll see how it is connected, how it flows and will get you to the results you desire, the results you may not think are achievable…but most certainly are.

Start with 3, it will have great impact on 2, which will lead to strength in 1. Control them all as you would control your equipment.
Make sense?
3…2…1…GO!


swathing-canola

Making Noise on (Emotional) Business Decisions

There has been a lot of noise this week about canola seed prices for the 2017 crop. Figures as high as $700 per bag (about $14/lb) for a sclerotinia resistant variety have been thrown around. As a moderate fan of Twitter,  I had to laugh at one particular tweet from @DavidKucher: “I’d have to #SellTheSwather in order to afford next year’s Invigor seed price increase”. This, of course, refers to the now popular production practice of straight-combining canola versus the traditional practice of swathing then harvesting.

This opens up the perennial challenge for farmers: costs are increasing with no guarantee that production prices will increase as well, margins become questionable, and emotional decisions get made. Is it better to keep the swather and plant cheaper canola seed? Or follow through with straight-combining canola, sell the swather, and grow the expensive variety that works better with straight-combining?

Aside from the cost/benefit sermon that would fit very well here, I believe that the real issue is differentiating between emotional decisions and informed decisions.

While I could go into a diatribe that includes harping on the how and why, instead, I’ll offer a list of questions that may help you determine whether or not to “sell the swather.”

  1. Will the more expensive seed provide enough extra yield to offset the added cost?
  2. Have you included the savings to your operating costs from eliminating the expense of swathing the crop?
  3. Does that saving to your operating expense include staff costs for you, or hired help, to run the swather?
  4. Have you considered the cost of owning the swather, and how eliminating it affects your fixed/overhead costs?
  5. How have you substantiated (actually measured) the seed loss from straight-combining and compared it to the loss from swathing?
  6. How cheap can you get new canola seed without sacrificing yield?
  7. What other benefits are you prepared to relinquish by opting for cheaper seed?
  8. Which canola variety matches your crop rotation, pest pressure, and operational timing & strategy?
  9. Which canola variety is most profitable?
  10. If you literally need to sell the swather to afford canola seed, can you see that there are bigger issues at play?

Selling assets to generate sufficient cash to cover operating costs is the beginning of the end. Selling assets that are minimally used to free up cash & leverage that could be redeployed elsewhere is a good strategy.

The answers the questions above are yours, not mine. There is no solution that I am prescribing by posing those questions. The solution will come from your answers. What I am prescribing is taking the time required to make informed decisions.

From the Home Quarter

Emotional decisions, made in haste, like shooting from the hip, will offer benefit…to someone…but not you.

Informed decisions keep you in control, on plan and on task, by ensuring there is benefit to you, your business, and your family.

For personalized guidance on determining if selling the swather is the right decision, call or email and ask about our Farm Profit Improvement Program™.


farmer tailgate computer

Farm Profitability Indexing

Farm Profitability Indexing

Late in 2015, I picked up on some interesting farm financial info during a presentation I attended as a part of CAFA. This information represents farms from a geographically vast cross section and revealed some interesting trends:

1. Gross Revenue per Acre has Trended Up

Gross Revenue bar chart

With 2007 being the base year with a value of 100, and also being the first year of the bull run in commodity prices, we can clearly see that while gross revenues are trending up, there is still great volatility in gross farm receipts. True, weather anomalies had a significant effect, but that’s farming, isn’t it?

2. Investment in Crop Inputs per Acre has Trended Up

Inputs bar chart

While gross revenue has seen volatility, and for three years including 2009-2011 gross revenue was at or near 2007 revenue levels, investment in inputs has only once seen a reduction year over year. In 2013, investment in inputs was 77.5% higher per acre than it was in 2007.

3. Gross Margin per Acre has Trended Up

Gross Margin bar chart

While gross margin is trending up, there was a significant decline in 2009 from the previous year that extended right through 2011. Even by 2012, gross margin had not returned to 2008 levels.

4. Operating and Fixed Costs per Acre are Trending Up

Oper and Fixed Costs bar chart

This figure would represent operating costs such as fuel, labor, and equipment costs, as well as fixed costs such as interest, land, and building costs.  Notice the steady increase that has never went down year over year, even through the low margin years of 2009-2011 operating & fixed costs continued to rise.

5. Net Income per Acre has Rebounded from Significant Reductions

Net Income bar chart

Net Income represents what is left over after operating your business, that profit which remains to cover administrative costs, make principal loan payments, and cover that other insignificant cash requirement: living costs (that was sarcasm if you couldn’t tell.)

In this illustration, we have calculated Net Income simply as Gross Margin LESS Operating & Fixed costs. Here we see that the low margin years of 2009-2011 actually extend right to 2012 with net income still below that of our base year 2007. This is the residual effect of increasing costs during a period of low margins (2009-2011) by continuing to have a negative effect on what would otherwise be a successful year in 2012.

Everything Dips but Expenses

This chart illustrates a dangerous trend: even when income goes down, operating & fixed expenses are allowed to continue to rise.

farm profitability line chart

By the end of 2011, net income had dropped to less than 30% of 2007 levels, yet operating and fixed costs were over 145% of 2007 levels. It took 2013 bringing about the largest crop in maybe forever to elevate net income back to 2007 levels.

Direct Questions

If Net Income represents the funds you have generated to cover living costs and make loan payments, how well does your worst net income from the last 10 years cover your living and loan payments in 2016?

What does the trend of your gross income, input costs, operating costs, and net income look like since 2007? Is it similar to what’s been presented here? What changes have you made to your operation based on your own information?

Gross margin should ideally be in lock step with operating and fixed costs. If you aren’t increasing your gross margin, why are you increasing your costs?

From the Home Quarter

This is a very telling experiment, but it is not the rule on all farms. The information presented here is an average across a list that spans all regions of the prairies, but heavily weighted on Saskatchewan. The experiment gets more interesting when you apply it to your own business. To lean on the 5% Rule first promoted by Danny Klinefelter, if in 2013 you could have been 5% better than the average in gross revenue, input costs, and operating & fixed costs as presented here, your net income would be 44% better than information presented, and index to 152.14% of the 2007 base year.

How does that sound?


goal planning

Goal Planning 2016

Thinking about 2016? Here are some of the goals that my clients are making a priority in the new-year:

  1. Reduce Equipment Cost per Acre
    Fully recognizing that equipment costs are one of the few expenses that are controllable on the farm, yet it is this controllable expense that is often least controlled, many farmers are looking hard to find efficiencies in their equipment line. The “nice to have” is being measured stringently against the “need to have” and consideration is being given to divesting assets that are deemed expendable.
  2. Establish a New Lender Relationship
    Each lender that plays in the ag field has an area of strength that makes them unique. Some rely heavily on equity; others focus more on cash flow. One may be strongest when lending for hard assets, another for operating credit, another for quota, and yet another for leasing. When your lender’s strong suit does not match your business plan, it is likely time to find a more fitting borrowing relationship.
    Unfortunately, if your borrowing approach has been piece-meal credit from several sources, the first step is for you to determine what your business goals are before seeking the right lender.
  3. Construct a Workable (Usable) Business Plan
    Having a formal business plan helps immensely when seeking a new lender. But if you’re only building a business plan to appease your lender, then please read on.
    A business plan is not a restriction like the “room seating capacity” on a liquor license. The business plan is your road map, your guide of the best actions to take in the immediate future based on expectations and identified risks. Your business plan will also lay out alternative maneuvers that will help you act quickly in the case of unforeseen circumstances.
    A business plan should not restrain you in a box; it should create awareness of opportunities & risks and lay out the best plan of action based on your existing situation and your goals.
  4. Define Appropriate Land Rental Rates
    In a trend fueled by greed, rental rates in many areas are now at unsustainable levels. Whether viewed as a factor of gross revenue per acre, or a factor of fair market value per acre, there are many geographic regions of the prairies where land rents are unsustainably high. (There are also some areas where rates are still very low/tenant favorable.) The landlords are not entirely to blame for getting us here, or for keeping us here. There first needed to be someone willing to pay exorbitant rates in the first place, and there continues to be those willing to keep paying them.
    Some of my clients desire a plan, a strategy, for determining a mutually beneficial land rent agreement with their landlords.  This can be a challenge when landlords are becoming increasingly distant and isolated from the goings on at the farmgate, not to mention absentee landlords who know nothing of modern farming. The argument for/against cash agreements, share agreements, and flexible agreements depends on many considerations, the most important of which is the relationship between landlord and tenant.
  5. Increase Financial Awareness and Confidence
    Even sophisticated business people find value in having an advisor critique the decisions being made on their farm. In a world with so much “noise,” confidence in our choices can be more difficult to realize when faced with multiple options (and no shortage of propaganda supporting/decrying each.) More and more farmers want an independent unbiased view of their financial position. Knowing where you stand today is key when trying to determine how to prepare for tomorrow.

Direct Questions

What are your goals for 2016? Have you documented them? Have you shared them with your family and/or your team?

How do you prioritize your goals? What makes them realistic and achievable?

What is your plan to ensure you meet your goals? What is your plan if circumstances change?

From the Home Quarter

A plan is only as good as the work that is put into it. It is true that things change very quickly in production agriculture: weather, markets, etc. Being prepared before such deviations will make managing the change easier, more efficient, and provide you more confidence when doing so. A business plan need not be a 48 page behemoth (who would actually refer back such large document throughout the year?) The purpose of your plan is to be prepared, decisive, and responsive. The physical document should reflect that.
We are helping several farm businesses refine their direction for 2016.
To set Your Farm Compass™ Strategy Plan for future success and growing profits, call me or send an email.

GFP FI 4

Knowing Your Costs – Part 2: “Misplaced Priorities”

Last week, this article weighed in on the trend of increasing costs in certain areas of the farm, namely
Operations (equipment, fuel, people,) and Facilities (buildings, land, financing.) These are the two most
controllable expense areas in farm management. These are the two cost areas that have seen the
biggest increases.

Over the winter, an old colleague and friend made the following tweet through @RCGFarmWise:
tweetMoe Russell has spent well over 30 years in farm finance
and management, and he has been tracking this kind of
info for a long time. I trust his integrity and his
information. Essentially over 5 crop years, this says that
farmers have increased equipment costs 100% faster
and land costs 400% faster than they’ve increased input
costs. In a time of high commodity prices with yields that
were typically above the long term average, this was not
uncommon.

Recently I took part in a Farm Business Development Initiative (FBDI) seminar that brought together
approved consultants and learning providers (of which I am both) to discuss updates to the program.
(Lean more at https://fbdi.gov.sk.ca/) During a conversation there, I overheard one attendee saying
how he listens to farmers “bemoaning the $60/ac they spend on seed, but nary a word to the $60/ac
increase in equipment costs they just took on.”

It is not surprising to see farmers looking to inputs first when trying to find ways to cut costs. We justify
it by lamenting increases to seed, fertilizer, and chemical prices. We validate cutting inputs by
acknowledging that inputs require the highest cash cost per acre of anything else on the farm. There are
sound ways to cut inputs; I was enjoying listening to many clients describing how they are using generic
herbicides this year, focusing heavily on scouting to verify the need for fungicides versus just spraying
anyway, etc. But when I heard one who wanted to eliminate a broadleaf herbicide in his cereals to cut
costs, even though I’m no agronomist, I quickly brought risk management to that conversation. Every
decision needs to have a risk/benefit or cost/benefit consideration. There is too much at stake!
More to the tweet above, looking under the right rock is not easy because it will force each of us to
acknowledge how and where we’ve allocated our capital. If we know we should not have increased our
“operations” cost, it’s difficult to face that reality, swallow pride, and make a better (or corrective)
decision. This is magnified in year like 2015 when excess moisture ahead of seeding turned into drought
for most of the growing season, and adding to that the late spring & early fall frosts, we could find that
many will miss their production targets. Are you confident you were using the most efficient agronomic
plan possible? Will your “operations” costs be harder to manage with missed production targets? Will
you be looking under the “inputs rock” to find ways to cut costs?

It has been said many times that “you cannot shrink your way to greatness.” Cutting inputs for the sake
of reducing costs is “shrinking” your ability to generate strong revenue. Even the best marketing cannot
make up for lost production. Your priorities need to continue for you to be:

1. The most proficient manager you can be to build a strategic and tactical plan that maximizes
ROI, personal wealth, and family values;

2. The most efficient producer you can be to lower your Unit Cost of Production;

3. The most equipped marketer you can be to hedge market risk, and generate sufficient gross
margin.

By misplacing your cost cutting priority onto the critical facets of your business as listed in the 3 points
above, you would be doing more harm than good, despite best intentions.

Direct Questions

Where have your costs experienced the greatest increase (inputs, operations, facilities)?
In recognizing the 3 critical facets above that require your full investment (management, production,
marketing,) where can you find costs that can you live without?

How confident are you in your awareness and abilities to enact appropriate cost management
strategies?

From the Home Quarter

You won’t hear me condone a general prescription of “more fertilizer,” but you will hear me advocate
for “better use of fertilizer.” It’s not about the producing biggest yield; it’s not about producing at the
lowest cost; it’s about producing the best yield at the most efficient cost. And the most efficient cost
also refers to “operations” and “facilities.” The allocation of your finite resources to those costs also
needs to be highly efficient. As a banker friend of mine likes to say, “Your crop doesn’t care what color
your equipment is.”
…or how new it is.
…or how much rent the landlord is squeezing out of you.
The purpose of your business is to grow your profits, maximize your ROI (return on investment,) and
increase your wealth. Spending over $200/ac on “operations & facilities” costs will not get you there.