Recession Readiness

Recession Readiness

Recessions happen. In cyclical industries, the effect of a recession on a business’ results is magnified similar to how the benefits of a market boom are magnified. Industries that are less cyclical do not experience such swings in results and therefore appear to be more stable. These industries are less elastic (think about grocery stores, gas stations, natural gas companies) and are even considered “recession proof.”

If your business isn’t recession proof, here are a few tips to help you mitigate the effects of a recession and survive the downturn…maybe even thrive during it.

Bullet Proof Your Balance Sheet 

A strong balance sheet is your best weapon in fighting the effects of a recession. This also means keeping balance in the balance sheet, specifically top vs bottom, not just (left side and right side) assets vs liabilities. Top vs bottom means focusing on current assets and current liabilities (I.E. your working capital -the top half of the balance sheet), and not just accumulating assets and equity (the bottom half of the balance sheet.) Too often, I’ve seen businesses punish their working capital in a race to retire long term debt. While creating that equity by reducing debt is great, if it costs you your strength in working capital, it isn’t making your balance sheet bullet proof. Bullet proof is strong equity AND abundant working capital.

“Bullet proof your balance sheet during the good times, so you can catapult ahead of your competitors during the bad times.
If you get greedy during the good times, you’ll likely be on your knees in the bad times.”
– Moe Russell

Trim the Fat

Where in your business have things gotten a little complacent? Where is your business over-equipped? What can be identified in your business as “nice to have” instead of “need to have”?
When business is good it becomes easy to let things slide, to acquire equipment that helps things along but isn’t necessary overall, to treat oneself in ways that weren’t affordable before. It’s human nature, it happens, but it’s not sustainable in business that faces recession.

It is the business owner’s/manager’s obligation to scrutinize assets and processes for opportunities to get lean. And getting lean BEFORE the recession, before the business is forced to make reductions, is far easier than when the situation has become dire.

Is making a change to diet and exercise easier and more beneficial before a heart attack (I.E. prevention) or after (I.E. recovery)?

Be Responsive

We’ve all heard it before, and have probably said it a time or two ourselves: things will get better, they’ll turn around, just give it time.

Famous last words?

No one can accurately and consistently predict how long the market cycles will last. Many think they can, but they can’t. So if your business generates results that do not meet expectations, doing nothing about it is sure to repeat the same results. How long can your business not meet expectations during a recession? If we knew how long the recession would last, we could answer that question confidently, but we already acknowledged our inability to prognosticate market cycle duration. The solution then becomes, “do something about it.”

If revenue was below target, find out why.
If profit missed expectations, find out why.
If your best employees have resigned unexpectedly, find out why.
Waiting for divine intervention to “turn things around” is rarely a successful plan.

Plan for Prosperity

The advice above does not only apply to preparing for an economic or market recession; it applies to big picture planning in your business as well. Because it doesn’t take macroeconomic factors to have an impact on your business, putting these actions in play anytime will prepare you and your business for the unforeseen hazards that can throw your best laid plans into the ditch.

If you want to “Be Better™” is starts with “being ready.”

KYN Know Your Numbers

KYN: Asset Turnover

In this edition of KYN: Know Your Numbers™

The Asset Turnover Ratio is one of my favorite metrics, especially when working with farm businesses. Despite what one may infer by the name, this ratio is not a promotion of turning over assets any faster than they already are. Quick turnover of assets is a major contributor to profitability challenges and cash flow challenges in the farm space.

In brief, the Asset Turnover Ratio is a measurement of how efficiently a business uses its assets to generate revenue. The calculation indicates how many dollars in revenue are generated by each dollar invested in assets. Higher is better.

The classic (textbook) version of the calculation is “Total Revenue” divided by “Average Total Assets.” So if your business generates $2.5million in revenue with $1million in average total assets, then your Asset Turnover Ration (ATR) is 2.5:1.0 (or for simplicity, just 2.5).

Here’s what I don’t like about Asset Turnover Ratio:

  • It uses “average” total assets. I have never liked using average; I feel “average” is way to make substandard performance look acceptable.
    But more to this case specifically, how do we “average” the total assets in your business? If you just take the total at the beginning and the end of the year and average those two figures, you will get an “average,” but how accurate is it? Should we be measuring assets each month and average 12 measurements? What about assets that are acquired then disposed of very quickly between measurement strike dates? I’m not a fan of average.
  • There is no clarity between which value to use when measuring assets (I.E. market value or book value)
  • The calculation does not, by definition, include leased assets (leasing has become quite popular.)
  • To be truly meaningful we must recognize that each industry has different Asset Turnover Ratios that are considered acceptable; sometimes the differences exist even within a similar space. Consider retailing: online retailers would have significantly lower investment in assets than retailers with brick & mortar store fronts. Online retailers would have significantly stronger ATR accordingly.

Once we clarify how we will approach the Asset Turnover Ratio, and maintain consistency in that approach so as to accurately trend your ATR metric over time, the ATR becomes a strong indicator of your business’ efficiency.

  1. Determine how you will value your assets:
    – when will you measure the asset values (frequency, date(s), etc.)
    – eliminate confusion and ambiguity…do two calculations, 1 with market value of assets, and 1 with book value
    – do not exclude assets under a capital lease, it will provide a false positive. Assets under a true “operating lease” can be excluded.
  2. Understand how your ATR applies to your industry. If there is a deviation in your results versus industry, is it stronger or weaker; what is causing it?

What I like about Asset Turnover Ratio:

  • it creates a stark illustration of how well a business utilizes its assets (which is a MAJOR draw on capital)
  • it is a key driver of ROA (Return on Assets – a KEY profitability ratio) and OPM (Operating Profit Margin – a KEY efficiency ratio) both of which need to be monitored closely
  • it shows the DOWNSIDE of asset accumulation (which, in the farm space, is a difficult conversation.)

Trending performed over many years by advisors with experience durations that are multiples of my own suggest that grain farms and cow/calf operations have ATR in the range of 0.33 to 0.17. Feedlots and dairies typically range from 1.0 to 0.5. User beware: these measurements are using the classical textbook definition.

Plan for Prosperity

As with any financial ratio, evaluating only one ratio does not tell the whole story. As with any financial analysis, how the numbers are quantified will have a profound effect on the results. This is not permission to ignore these important financial indicators, but more so a call to action to understand how each one affects your business so that you can make the informed decisions that will lead to profitable growth.

Not understanding the factors that affect your business is no excuse to ignore them…especially when they are within your control.

KYN Know Your Numbers

KYN: Debt Structure

In this edition of KYN: Know Your Numbers™, we build on the previous topic of Debt Ratio by looking deeper at Debt Structure.

Debt Structure refers to the ratio of current/short term debt to long term debt in your business. This metric provides insight into how you are financing your business’ needs.

Those who know me know that I am consistent in my belief that short term assets should secure short term debt and long term assets should secure long term debt. This is because short term debt (think about your current liabilities) is expected to be paid off with current assets (like cash) whereas long term debt would be paid out with fixed assets (if a lump sum is required versus retiring the debt over time with regular payments.) That premise is Financial Management 101, and while not a hard and fast rule, it is sound guidance.

More to the Debt Structure conversation, we calculate this ratio by dividing Current Liabilities (all payments and payables due in the next 12 months) by Total Liabilities; same for Long Term Liabilities (total debt not yet due within the next 12 months.)  Here is an example:

Current Liabilities Long Term Liabilities

Accounts Payable

$1,350,000 Long Term Debt (LTD) $3,100,000

Overdraft

$687,000

Shareholder Loan

$300,000

Taxes Payable

$27,350

Current Portion LTD

$487,000

TOTAL $2,551,350   TOTAL

$3,400,000

In this example, there are total liabilities of $5,951,350 (calculated as $2,551,350 in Current Liabilities + $3,400,000 in Long Term Liabilities.) The debt structure is 42.8% short term and 57.2% long term. While this is good to know, the next question is “So what?”

On its own, the debt structure ratio does not carry much weight. The value is found in trending the debt structure ratio. For example, if your short term debt trend is increasing it may be an indication of liquidity challenges in your business.

Ideally, calculating your Debt Structure Ratio will cause you to ask more questions and seek more clarity, such as:

  • What types of debt make up my short term liabilities? What are these debts for?
  • Are my short term liabilities trending up, down, or remaining fairly steady? Why?
  • What is the right ratio of Debt Structure for my business/industry?

With economic indicators preparing us for more volatility than years past, and with interest rate increases on the horizon, it is a good idea to have abundant clarity on your overall debt situation. Understanding your Debt Structure, including how your Debt Structure will affect your business under different economic situations, creates an opportunity to “get your house in order,” so to speak, before things start happening.

Plan for Prosperity

The winds of change are blowing. Are you simply going to lower your sail and wait it out, hoping to survive whatever comes? Or are you preparing to chart new courses so that whatever winds you get you are still able to make progress and move forward?

KYN Know Your Numbers

KYN: Debt Ratio

You have probably been told that knowing your numbers is critical to your business management success. Truer words are rarely spoken. However, it is not lost on me that there are A LOT of numbers at play, and numerous measurements you can take…it is easy to become overwhelmed! The question then begs, “Which numbers are the important ones to know?”

If you are in business, you have heard about KYC: Know Your Customer. Well this is “KYN: Know Your Numbers™” and we begin with the Debt Ratio.

The Debt Ratio (also known as Debt to Asset Ratio) is a leverage ratio, meaning it is a measurement of the debt your business holds. The calculation is “Total Liabilities divided by Total Assets” and the result of the calculation tells you how much of your assets is financed. For example, if you have $5million in total liabilities and $10million in assets, your Debt Ratio is 0.5 : 1 (or just 0.5 for simplicity.)

Each industry has a “comfort zone” for where a debt ratio should be. This comfort zone is also flexible (to an extent) depending on where you are in your business’ life cycle. Knowing what the comfort zone is for the industry in which you operate is important.

Why I am Cautious About the Debt Ratio

  1. Because it lends itself to subjective information. Here is what I mean: when buying something, we want the price to be lower; when selling something, we want the price to be higher. While compiling the value of all your assets (a “selling” mindset) it is easy to value what you have at a premium, because A) it is yours, B) you love it, and C) you want to show that it was a good decision to acquire it.
    If the value of business assets is “padded,” then the calculation presents a skewed result to the positive.
  2. Off Balance Sheet Items. Over my 15 years as a lender and business adviser, I couldn’t even count the number of “off balance sheet items” I have had to discover. Whether it be trade credit from a vendor (which would lower the total liabilities), leases and leased equipment (which lowers both the total assets and total liabilities), or “forgotten” accounts payable (which, again, lowers total liabilities), the figures that somehow do not get included in the calculation can lead to a profoundly different result
    If the value of the liabilities is incomplete, then the calculation presents a skewed result to the positive.
  3. Appreciation of asset values “support” increasing levels of debt. Assets that have experienced an appreciation in value (such as real estate or quota) will lower the Debt Ratio with all other things being equal. This can provide an false sense of security to then take on more debt because “the debt ratio is strong and improving.” This is especially dangerous when the new debt is short term/operating debt. Should the value of those assets decline, there will quickly be pressure put onto the business by creditors.

These examples are not to suggest that there is malicious intent when providing information to do this ratio, but merely to draw attention to a subconscious behavior that is affected by emotion.

Plan for Prosperity

Knowing your numbers is critical, but only looking at current numbers may not tell you enough. What has been the trend of your debt levels, your assets values, and subsequently your debt to asset ratio? What has led to the changes in your asset values? Was it asset appreciation? Do your assets now include far more depreciating assets than before? What has led to the change in your liabilities? Was it debt paydown, or new long term debt? Was it additional short term debt/operating debt? Are your current liabilities making up a greater portion of your total liabilities than 5 years ago (or 10 years ago?)

In the next KYN commentary, we will discuss the trend of short term liabilities & long term liabilities, and how it affects Debt Structure.

The Uncontrollables

The Uncontrollables

There are many factors at play which affect your business each day. (Oh, look…I’m a poet and didn’t even know it.)

How is your business affected by:

  • NAFTA
  • Trade Wars
  • Real Wars
  • Geopolitical strife
  • Interest Rates
  • Income Tax
  • Sales Tax
  • Foreign Exchange
  • Oil Prices
  • Commodity Prices
  • Utility Prices
  • Inflation
  • Deflation
  • Theft and Vandalism
  • Weather and Natural Disasters
  • The 4 D’s (Death, Divorce, Disagreement, Disability)
  • Physical, Emotional, Spiritual, and Mental Health

You have full control over none of these. At best, you might have partial influence over two or three on that list. Yet you, your business, and ultimately your family will all feel an effect that falls somewhere between minimal and profound.

The way to minimize the negative effect of any of The Uncontrollables is to prepare. You wouldn’t head out on a road trip with an empty fuel tank and no spare tire, would you?

A strong balance sheet (meaning low Debt to Equity along with surplus Working Capital) will mitigate the negative effects of The Uncontrollables. Conducting sensitivity analyses on the likes of tariffs, interest rate changes, tax changes, and foreign exchange will provide your business with the critical knowledge needed to make informed decisions in the face of The Uncontrollables.

Plan for Prosperity

We can scream and holler, protest, or pout all we like in the face of The Uncontrollables; it will change nothing.

God grant me the serenity to accept the things I cannot change, the courage to change the things I can, and the wisdom to know the difference.

-Reinhold Niebuhr

Having the wisdom to know the difference between between what you can control and what you can’t is merely the fist step; acknowledgement of what you cannot control on its own will not mitigate the effect of The Uncontrollables. Action will trump intention every time.

Take action to protect your business, your family, your legacy. You need not be a rudderless vessel helplessly surviving on the mercy of the sea. There is no need to be stranded on the side of the road with no fuel, no spare tire, and no phone.

Cycles

Cycles

“It’s cyclical.”

This statement applies to so much in our world. From interest rates to fashion trends, from climate to markets, so much of what we see, hear, do, say, and feel is cyclical.

In meeting with commercial bankers recently, here are some of the points I took special note of in the conversation:

  • Many of our clients are struggling through a slow-down right now.
  • Very few applications are for growth. Most are to restructure, especially in preparation for increases to interest rates.
  • So many of our clients do not understand their balance sheet or how it affects their business.

The first bullet above led to a longer portion of the total conversation. The banker who made this statement went on to describe how the boom years we have recently enjoyed led many people (entrepreneurs and employed folks alike) to create some bad habits, such as not preserving cash (working capital) and increasing their debt. When things slowed down and business got tight, the debt payments still need to be made, as does payroll, and utility bills. Somehow, the elevated lifestyle expenditures that cycled up during times of easy prosperity did not cycle back down when profitability and cash flow did.

A similar sentiment was gleaned from an ag banker (who asked to remain nameless while granting me permission to include the response below) serving North West Saskatchewan and North East Alberta. When I asked about what the trend has been in that part of the province for farm land prices and rent rates, the response included the following:

“Profitability and cashflow has been squeezed the past 3 years, due to a combination of the weather anomalies (in most cases, more moisture than needed), increase in production costs, and financing needs (and in some cases may be “wants” vs actual “needs”).  Those producers/files with the stronger balance sheets and working capital positions, have fared better through this, compared to some others.”

For any of you who think that your business (or industry) is the only one to have to manage cycles, please understand that cycles are industry agnostic. The market does not care what you’ve been through, what your plans are, or what your name is. Your business plan needs to include M.O.C. – Management of Cycles.

Long time readers of my commentaries know that I have referenced Moe Russell of Panora, IA on more than one occasion. It was from Moe that I first heard the term M.O.C. – Management of Cycles. Moe tells the story of how he picked it up during a chance conversation in an airport with Matthias Grundler, the then Head of Procurement for Daimler. When asked, Grundler admitted that M.O.C. (management of cycles) was his greatest concern.

What cycle are we headed into right now? If we knew, if anyone truly knew, business would be so much easier! The risk, of course, is that we tend to get caught up in recency bias:

Recency bias occurs when people more prominently recall and emphasize recent events and observations than those in the near or distant past.
By putting more credence into recent successes rather than recognition of impending change, we set ourselves up for what is happening in many small to medium sized businesses right now: financial stress leading to major upheaval in the business.

Plan for Prosperity

Trying to fight against the market cycles (or industry cycles as it may be) is like trying to fight gravity. Like it or not, it will affect you. Cycles have been happening for a lot longer than you’ve been in business, and will continue to occur long after you are gone!

“Bullet proof your balance sheet during the good times, so you can catapult ahead of your competitors during the bad times.
If you get greedy during the good times, you’ll likely be on your knees in the bad times.”

Moe Russell
President, Russell Consulting Group

Look back to the response above from my ag banker colleague; those (businesses) with the stronger balance sheets and working capital…have fared better through this…” The businesses that built a balance sheet to protect them during a down cycle are the businesses that are ready, and as such will take advantage of the opportunities presented by a down cycle. Those opportunities range from additional labor (that may have been laid off from a financially weaker competitor), picking up assets (land, equipment, or buildings) that may have been relinquished during the down cycle (and are likely far cheaper now,) or possibly even buying out a competitor who has been left in a weakened state by the market cycle.

“Market cycles will hurt some, but offer opportunity to others.
The difference between who suffers and who prospers is…Who’s Ready.”

– Kim Gerencser (March 2013)

Which side of that line do you want to be?

balance sheet

Balanced View of the Balance Sheet

Like any piece of business information, the balance sheet is only as useful as the quality and accuracy of the information presented in it. In my experience, the balance sheet either gets too much emphasis or not enough. Too much when a business is not profitable, but always falls back on “Well we (they) have strong equity.” Too little when a young business is in high growth phase and is focused on nothing more than the next expansion opportunity, usually at all costs.

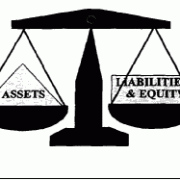
The construction of a balance sheet is quite simple: assets on the left, liabilities plus owner’s equity on the right. As the name implies, the two sides must balance. So when liabilities are greater than the assets, there is negative equity. Yes, you can have negative equity, but not for long unless you have an incredibly patient banker.

When describing the instances above where the balance sheet gets too much emphasis, the focus is clearly on the bottom half of the balance sheet, specifically the long term assets & long term liabilities and the owner’s equity. The equity is usually provided by appreciation of long term business assets, and if the equity is built almost solely on that and not retained earnings (net profit from operations) then there is definitely too much emphasis put on the bottom half of the balance sheet, namely equity.

The top half of the balance sheet is where most of the trouble starts. The top half is where we find the current assets and current liabilities; the difference between the two is working capital. Current liabilities have grown to dangerous levels from ever increasing loan and lease payments, cash advances, and trade credit. When current liabilities exceed current assets, you have negative working capital.

If your balance sheet has negative equity and negative working capital, you are the definition of insolvent, and the next phone you make is likely 1-800-AUCTION.

Ok, so there is equity on your balance sheet, more than enough to cover off the negative working capital. A patient and understanding lender might be willing to help you tap into that equity to “recapitalize” the business.  Do that once if you need to. By the time you’ve gone to that well two or three times, you’re likely closer to needing the classifieds to find a job rather than the next deal on equipment.

Equity doesn’t pay bills. Cash does.

Why punish your cash and working capital by rushing debt repayment to create equity?

Plan for Prosperity

The next time you catch yourself, or anyone else for that matter, leaning hard on the bottom of the balance sheet, namely the equity portion, think long and hard about why the focus is not balanced between the top half and bottom half of the balance sheet.

Not only do the left and right sides of the balance sheet need to balance, but so does the top and bottom.

Rayglen 2018_2019 proj crop returns

The Great Profitability Challenge of 2018

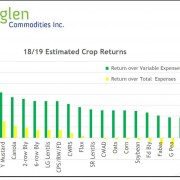
The graphic seen above was shared at a recent CAFA chapter meeting (Canadian Association of Farm Advisors) and forwarded to me by one of my fellow CAFA colleagues who was in attendance. By coming from a reputable commodity trading entity, there is a level of trust we can have in the data presented.

And the (projected) data looks bleak.

With only four crops expecting a net profit to exceed $50 per acre by any respectable amount, the profitable options for 2018 are few and far between. No wonder the common sentiment this winter is “I don’t know what to grow this year; doesn’t look like anything will make a profit.”

Considering the four crops in the Rayglen projection that are close to abundantly profitable are 1 variety of chickpeas and 3 varieties of mustard, it’s pretty clear that your geography becomes part of your challenge. Yes, wheat, barley, flax and canola are also projected to be positive, but are any of them sufficient based on the risk and/or your personal circumstances on your farm?

Here are some questions that I feel must be asked:

  1. Is crop rotation holding you back from loading up on what few profitable options are available?
    I recently heard a lender suggest that those who blow up their crop plan to chase the perceived winner, by his account, usually miss out.
    This can be often true because of the long cash conversion cycle in production agriculture. Farmers bet on a crop plan that they expect will make them money, but a lot can happen between February and harvest…the market giveth and the market taketh away! If there is one thing Western Canadian grain farmers can do, it’s produce! We can overproduce a commodity in as little as one crop cycle, and as such in July or August drive down what was a winning price back in February!
    The lender referenced above went on to say that sticking to your proven crop plan is the way to hit a winner most years, maybe even multiple winners!
  2. Is $50 per acre or even $75 per acre net profit realistic, or even sufficient?
    How much was expected yield and/or price “padded” in that projection? How much were total costs “softened”? Were there 4-6 applications of fungicide built in to those chickpea projections?
    Generalist type of prognostications like this one need to be taken with more than just a grain of salt. Do the “variable” and “total” expenses displayed reflect your farm? What is included in each category? Are they including all expenses, including the PAPERCLIPS? There is much ambiguity in figures like these.
  3. Do whole farm expenses reflect the capability of the crop plan, or is the crop plan now expected to meet the ever-increasing farm expenses?
    Recently, I’ve overheard a couple of pundits suggest that whole farm expenses are now nearing $400 per acre. If true, that relegates many crop plans into the underworld of “operating loss.” I’ve gone on record several times suggesting that the elongated commodity boom recently ended has allowed many bad habits to form at the farmgate. The habits in question surround the insatiable appetite for newer/bigger farm equipment, larger land base, and higher living standards. It wasn’t long ago that top tier farmers kept their operating costs (described by some as labor, power, & equipment) in the range of $90-$100/ac, and these pundits now suggest that the best of the best are in the $140-$150/ac range. That $50/ac increase in what is the most controllable facet of farm expenses clearly has shaken the profitability potential to its core on many farms. And that only applies to those whose operating costs have increased by ONLY $50…

Plan for Prosperity

The recipe for profitability is simple:

  • Have a plan (how/why/what you do);
  • Run lean;
  • Know your numbers & market to your numbers;
  • Maintain discipline.

Of course, if it was as simple to do as it is to describe, everyone would simply do it. Also, did you notice that nowhere was there anything in that recipe about production or farm size? In the commodity business, the winner is the one who produces at the lowest cost per unit of production; the best way to achieve that is to have a plan and maintain discipline to it, get lean and stay that way, and finally market your production to your numbers (not to your emotion.) If you’re have challenges with any of the four ingredients in that recipe, why haven’t you picked up the phone and called for help already?


Financial data

Questions from Farmers

Over the winter, I do a number of speaking engagements, usually around finance and management. Here are some questions and comments from the audience, and excerpts of my response.


Farmer: How do I improve my working capital and current ratio?

Kim: Simply put, either reduce your current liabilities or increase your current assets…or both! Considering current liabilities, what makes up the lion’s share? Typically it’s lines of credit, cash advances, and loan payments due in the current year. So to achieve the goal of reducing current liabilities, over time (because it will take time) wean yourself off of operating credit. Protect, even hoard, your cash over time so that you can achieve working capital equal to 50% of your annual cash costs. By the time you achieve that level of working capital, your current ratio should be very strong.


Farmer: As someone who is still in growth phase, I can’t expect the kind of return on my cash costs that you’re suggesting. Isn’t it okay to run at zero because I’m in a growth phase?

Kim: First, your business and the industry are cyclical, so yes there will be years when your return is zero, but don’t accept being at zero year over year for any length of time. That being said, your growth phase is likely running your cash to zero, and what I’m prescribing as “return on cash costs” is a profitability measure; they’re different. A business can be profitable and have no cash because the cash might be immediately fed directly into the growth of the business. Yes, you’re going to run tight on cash during a growth phase, but don’t accept poor profitability.


The following are a sample of comments made by participants:

  • Mentioning “Mission” and “Vision” statements is interesting. I don’t think having one makes you more money, but it’s funny how those that have one are doing better than those that don’t.
  • I’m trying to figure out how to value unborn calves when looking at my working capital.
  • This current ratio figure is going to swing widely depending on when (what time of year) you do it.
  • Don’t buy (something like equipment or pick-up trucks) just because you have some cash.
  • We’ve got someone doing our books for us, and we review all our ratios monthly.
  • I never viewed HR as a risk before.
  • Every farmer should attend this seminar. Even if they know everything you’ve discussed, it’s a good refresher.


Plan for Prosperity

There is a reason I use the heading “Plan for Prosperity” for my closing comments: we need to plan our businesses. Whether that be our 10 year strategy, the next 18 months of cash flow, or determining how our growth aspirations would be affected by a rising dollar or rising interest rates, planning is key to your business. And the planning must, yes…MUST, go beyond the crop plan. That crop plan is but one aspect of your business. Don’t ignore the others unless you don’t want prosperity.

When considering how to approach the plans you must address in your business, consider the following three questions in order:

  1. Why do we do what we do?
  2. What do we want to achieve?
  3. How will we do it?

If you’ve managed to provide honest and detailed answers, the rest of the “planning” becomes much more clear.


roi

Sustainability – What is It?

Are you sick of buzzwords? They’re everywhere…all the time. Some are actually impactful, but all are meaningless without context.

One buzzword that actually has some meat is “sustainability,” but in the next breath it’s meaningless because it can be over-used, misinterpreted, or put into the wrong context. Often times the word is attached to “environmental” sustainability and conjures up visions of environmental enthusiasts/activists/evangelists, but the term sustainability is simply defined as being able to last or continue for a long time.
Ref. https://www.merriam-webster.com/dictionary/sustainable

Using that frame of reference, let’s focus on the financial aspect.

You have put many changes in place in your business over the years. Ranging from new/improved processes to increased size & scale, each change has had an impact on your business. No question, your intention has always been to implement a change for the betterment of your business. But prior to initiating any action, was an assessment of the sustainability of the proposed change ever done? How did you quantify the impact of the change?

There are many success stories floating around lately about producers who gave up some rented land and increased their overall business profits from doing so. While this is counterintuitive to the deeply embedded mindset that “bigger is better,” clearly the financial sustainability of the status quo was in question for these particular operations.

What is the financial sustainability of increasing the size of the factory (more land), adding capacity (more/bigger/newer equipment), or increasing labor (more people)? Each of these needs to be evaluated beyond the obvious cash costs. What are the incidental costs, meaning:

  • Increasing the size of the factory (More Land) carries
    • Higher ownership/operating costs for PP&E (property, plant, & equipment);
    • More cash to service debt on the asset;
    • Change in insurance costs (which way will premiums go, up or down?)
    • Change in utilities costs (which way will heat and power go, up or down?)
    • More working capital to be able to utilize the increased scale of the business;
    • Etc.
  • Adding Capacity (More/Bigger/Newer Equipment) carries
    • Higher costs for PP&E (property, plant, & equipment);
    • More cash to service debt on the asset;
    • Change in insurance costs (which way will premiums go, up or down?)
    • Change in operating costs (which way will fuel and repairs go, up or down?)
    • Will you need to add staff (another operator)?
    • Will you need to upgrade your systems and/or technology so the new equipment can operate relatively seamlessly in your existing set-up?
  • Increasing Labor (More People) carries
    • Additional cost for benefits (pension, vacation, etc.)
    • Higher management requirement (to approve holidays, implement performance evaluations, conduct scheduling);
    • Any additional tools for employees to use (hand tools, vehicles, computers, etc.)
    • Training costs.

Each of these points above has an impact on the decision to increase the size of the factory, the capacity of the equipment, or the volume of human capital in your business. Evaluating each decision above with a broader perspective, which would include an expected ROI (Return on Investment), is the best way to understand the sustainability of each option. If the desired change to your business provides insufficient ROI, it puts the sustainability of not only the project but your entire business in question. At minimum, ROI must exceed the cost of borrowed capital that was utilized for the project.

Plan for Prosperity

Buzzwords aside, sustainability is as much of a mindset as it is a business practice. Sustainability deserves a place in your business’ values and mission & vision statements. It should make up a component of every business decision that you consider. If your business is not sustainable, what are your plans for afterwards?