KYN Know Your Numbers

KYN: Asset Turnover

In this edition of KYN: Know Your Numbers™

The Asset Turnover Ratio is one of my favorite metrics, especially when working with farm businesses. Despite what one may infer by the name, this ratio is not a promotion of turning over assets any faster than they already are. Quick turnover of assets is a major contributor to profitability challenges and cash flow challenges in the farm space.

In brief, the Asset Turnover Ratio is a measurement of how efficiently a business uses its assets to generate revenue. The calculation indicates how many dollars in revenue are generated by each dollar invested in assets. Higher is better.

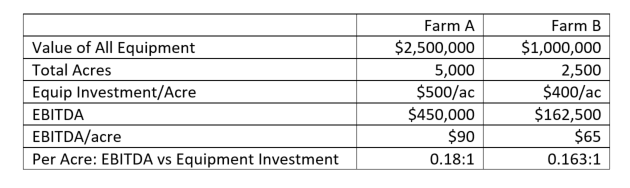
The classic (textbook) version of the calculation is “Total Revenue” divided by “Average Total Assets.” So if your business generates $2.5million in revenue with $1million in average total assets, then your Asset Turnover Ration (ATR) is 2.5:1.0 (or for simplicity, just 2.5).

Here’s what I don’t like about Asset Turnover Ratio:

  • It uses “average” total assets. I have never liked using average; I feel “average” is way to make substandard performance look acceptable.
    But more to this case specifically, how do we “average” the total assets in your business? If you just take the total at the beginning and the end of the year and average those two figures, you will get an “average,” but how accurate is it? Should we be measuring assets each month and average 12 measurements? What about assets that are acquired then disposed of very quickly between measurement strike dates? I’m not a fan of average.
  • There is no clarity between which value to use when measuring assets (I.E. market value or book value)
  • The calculation does not, by definition, include leased assets (leasing has become quite popular.)
  • To be truly meaningful we must recognize that each industry has different Asset Turnover Ratios that are considered acceptable; sometimes the differences exist even within a similar space. Consider retailing: online retailers would have significantly lower investment in assets than retailers with brick & mortar store fronts. Online retailers would have significantly stronger ATR accordingly.

Once we clarify how we will approach the Asset Turnover Ratio, and maintain consistency in that approach so as to accurately trend your ATR metric over time, the ATR becomes a strong indicator of your business’ efficiency.

  1. Determine how you will value your assets:
    – when will you measure the asset values (frequency, date(s), etc.)
    – eliminate confusion and ambiguity…do two calculations, 1 with market value of assets, and 1 with book value
    – do not exclude assets under a capital lease, it will provide a false positive. Assets under a true “operating lease” can be excluded.
  2. Understand how your ATR applies to your industry. If there is a deviation in your results versus industry, is it stronger or weaker; what is causing it?

What I like about Asset Turnover Ratio:

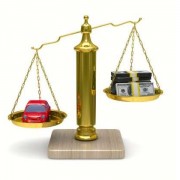
  • it creates a stark illustration of how well a business utilizes its assets (which is a MAJOR draw on capital)
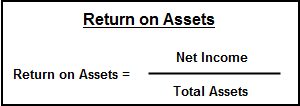
  • it is a key driver of ROA (Return on Assets – a KEY profitability ratio) and OPM (Operating Profit Margin – a KEY efficiency ratio) both of which need to be monitored closely
  • it shows the DOWNSIDE of asset accumulation (which, in the farm space, is a difficult conversation.)

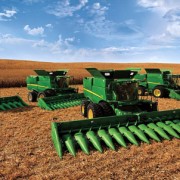
Trending performed over many years by advisors with experience durations that are multiples of my own suggest that grain farms and cow/calf operations have ATR in the range of 0.33 to 0.17. Feedlots and dairies typically range from 1.0 to 0.5. User beware: these measurements are using the classical textbook definition.

Plan for Prosperity

As with any financial ratio, evaluating only one ratio does not tell the whole story. As with any financial analysis, how the numbers are quantified will have a profound effect on the results. This is not permission to ignore these important financial indicators, but more so a call to action to understand how each one affects your business so that you can make the informed decisions that will lead to profitable growth.

Not understanding the factors that affect your business is no excuse to ignore them…especially when they are within your control.

What Do You Care About

What Do You Care About?

What do you care about?

In a conversation with a fellow business advisor recently, the topic was about how much demand for our services there would be this fall considering the drought, rising interest rates, a rising Canadian dollar, and volatile crop prices. He said to me, “The work we do is important; people need our help,” and then went on to say how he expects there to be significant demand from the marketplace for our financial advisory work.

I questioned whether the farming industry is “generally” ready to place enough importance on financial matters of cash flow, profitability, and leverage to create the demand he described. My experience is that there are pockets of business people who see the value and hire the help, but generally the financial woes faced at the farmgate have yet to cause enough pain to spur on action.

Change will only occur when the pain of change is less than the pain of staying the same.

It seems like there is always something more important.

His response, “People will tell you what is important, and very clearly too! It’s their behavior. Their actions show you very clearly what they care about most.”

Based on how farm equipment sales continue to be incredibly strong, despite challenges to cash flow and profitability, it’s not rocket-surgery to figure out what is a top priority among farmers…

Faced with a choice of one response over the other, how would you choose:
What do you care about?
a)
Ensuring a profitable enterprise for long term growth and sustainability
b) Having a modern/late model fleet of machinery

a) Investing in the crop that provides your income
b) Investing in an “asset” that is a merely a cost and reduces your profitability 5 different ways

a) Getting bigger
b) Getting better

Years ago (WAY back) when I drove a fuel truck for a living, one of my customers always needed significantly less heater fuel (fuel oil) than any other customer on the regular monthly top-ups during one particularly cold winter. It’s not that his house was that new or air-tight; it was not that he didn’t have the money to pay for the fuel (they were a wealthy family.) It was that, by his own admission, he “kept it as cool as possible in the house, about 64 (degrees Fahrenheit).” This was a family of 6, with kids ranging in age from 10-18, whose comfort was less important than money. By his behavior, it was clear what he cared about most.

To Plan for Prosperity

If you feel like you might be facing a choice this year as you evaluate your financial performance, you won’t be alone. Hard choices need to be made by business-people everywhere, every year, all the time. When considering what choice to make, first ask yourself “What do you care about”. When what you care about is clear, the strategy and the action become obvious.

If you are having difficulty defining what you care about, look at past behavior: it will paint the picture for you.

Return on Assets

ROA (Return on Assets)

Return on assets, or “ROA” as we’ll refer to it, is an often overlooked financial metric on the farm. Partly, I think it is because there is a culture in agriculture that places too much emphasis, even “romanticizes” the accumulation of assets (namely land, but mostly equipment.) This doesn’t necessarily bode well for ROA calculations. But the greater reason ROA isn’t a regular discussion on the farm, in my experience, is because it is not understood.

return on assets formula

The math is simple to understand, so when I say “ROA is not understood,” I mean that the significance of ROA, and its impact, is not appreciated.

Return on Assets is a profitability measure. Its key drivers are operating profit margin and the “asset turnover ratio.” ROA should be greater than the cost of borrowed capital.

Let’s ask the question: “When calculating ROA, do we use market value or cost basis of assets in the denominator?” The simple answer is “BOTH!”
Do two calculations:
1) using “cost” to measure actual operational performance;
2) using market value to measure “opportunity analysis” which is a nice way of saying “could you invest in other assets that might generate a better return than your farm assets?”

Operating profit margin is calculated as net farm income divided gross farm revenue, and is a key driver of Return on Assets.

The asset turnover ratio (also a key driver of ROA) measures how efficiently a business’ assets are being used to generate revenue. It is calculated as total revenue divided by total assets. The crux of this measurement is that it has a way of showing the downside of asset accumulation. The results of this calculation illustrate how many dollars in revenue your business generates for every dollar invested in assets. While there is no clear benchmark for this metric, I’ve heard farm advisors with over 3 decades experience share figures that range from 0.25 to 0.50. This means that for every dollar of investment in assets, the business generates 25-50 cents of revenue (NOTE, that is REVENUE not PROFIT).

If assets increase and revenue does not, the asset turnover figure trends negatively.
If revenue increases and profit does not, the operating profit margin trends negatively.
Increasing revenue alone will not positively affect ROA. “Getting bigger” or “producing more” alone without increasing profit does not make a difference. If you recall: “Better is better before bigger is better…”

To Plan for Prosperity

As you will find in many of these regular commentaries, the financial measurements described within are each but one of many practical tools to be used in the analysis of your business. Return on Assets cannot be used on its own to determine the strength or weakness of your operation. But used in combination with other key metrics, we can determine where the hot issues are, and how to fix them so that your business can maximize efficiency, cash flow, and profitability.

Per Acre Equipment Investment

Per Acre Equipment Calculation

In the June 8, 2017 edition of the Western Producer, columnist Kevin Hursh penned Per acre equipment calculation can be revealing. As is typical, Hursh hits the nail on the head with this piece by suggesting farms should know their equipment investment per acre. His column goes on to describe how new equipment has seen significant increases in SRP (suggester retail price) over the last few years, contributing greatly to the elevating of the “per acre equipment calculation.”

First, let’s figure out where you are at. Add up the current value of all your equipment, owned and leased. If that total is $2.5million, and if your farm is 5,000 acres, your equipment investment per acre is $500. If we compare that to a 2,500 acre farm with $1million invested in equipment (therefore $400/ac), who is better off?

Measure it against earnings

Last year, I had a client tell me about a meeting with his lender. This particular client is small acreage, relatively speaking (under 1,000ac in crop) and yet was quite well equipped for his acres. He carried minimal debt, and despite some cash flow challenges over the previous two years, his working capital was still very strong. He was seeking a high-clearance sprayer so that he could ensure timely fungicide applications for his lentils, and other high value crops. The feedback he received from his lender was that his “equipment investment per acre was to high.” On the basis of that single calculation, it most certainly was. What the lender failed to evaluate was the entire farm profitability. Because of the small acre base, my client was able to produce a rotation of high-management high value crops. His net profit per acre was almost double a typical grain farm. His ability to justify a high equipment investment per acre was evident. Needless to say, he acquired his sprayer (a used model valued at just north of $100,000) pushing is equipment investment per acre from $484 to $644.

Let’s go back to the 2 fictional examples above.
EBITDA vs Per Acre Eq InvIf we only looked at equipment investment per acre, we would likely conclude that Farm B is in a better situation by only having $400/ac invested in equipment versus Farm A having $500/ac. Yet when we dig further by bringing EBITDA into the calculation (EBITDA is Earnings Before Interest Taxes Depreciation & Amortization) we discover that Farm A generates stronger EBITDA per acre than Farm B, and is therefore possibly justified in having a higher investment per acre in equipment. In practical applications, even this doesn’t go far enough to determine which is better, but it’s a start.

To Plan for Prosperity

Delving into management calculations can be daunting and confusing. If we don’t know what to look for, how it compares, or even if we’re not measuring anything, we’re already behind before getting started. Begin by measuring the many facets of your business; in this case, “What is your equipment investment per acre?” How has is changed over the last five to ten years?

Relating back to my client, his EBITDA was a whisker under $120/ac, so his EBITDA to Equipment Investment on a per acre basis was about 0.186:1. This means that with his equipment investment of $644/ac will generate about $0.186/ac in EBITDA. Is that a good metric? As Kevin Hursh closed his column, “It’s unfortunate that more information isn’t available on the typical investment levels in each region. That would allow producers to make more relevant comparisons.”

Free Land

Free Land

Getting farm land for free, whether it be purchase or rent, still won’t be profitable if operating and overhead costs are too high. If overall farm operations require high yields and prices to cover your break-even point, then you’re running way too close to the line.

Ask yourself if your 2017 break-even yield is near, or well below, your 5 year production average. If it is near, then there isn’t much wiggle room, is there? Everything needs to go right, including the external factors you cannot control, like weather.

Does your 2017 crop plan include a sensitivity test? What is your sensitivity to a 10% decrease in yield? What is your sensitivity to a 10% decrease is price? How close do either, or both combined, bring you to break-even?

To Plan for Prosperity

To quote my old friend Moe Russell, “What rabbits are you chasing?” Using Moe’s analogy, the rabbits you should be chasing are found in your operations costs: machinery, labor, repairs & maintenance, fuel, etc, and in your overhead costs: interest, carrying costs, etc. These are the internal factors, the factors that you can control.  And if these have gotten out of control, even free land won’t be profitable.

inadequate working capital

Eat to Live, or Live to Eat

This week’s title is common phrasing when dealing with people who struggle with weight loss. While there are many factors that come into play for those who struggle with weight, a person’s caloric intake is often a major contributor. Making smart decisions about what to eat, when to eat, and how much to eat can be challenging for many people who are trying to do a better job of managing their health, not just those with weight issues. The question of “why” they eat gets into the psychology of the issue, which, coincidentally, leads into the real topic behind this week’s commentary.

Spending time at Canada’s Farm Progress Show in Regina each June has been something I’ve looked forward to for as long as I can recall. Remember, I knew I wanted to farm since I was less than 10 years old, so the Farm Progress Show was a more tantalizing buffet to the teenage me than even an actual buffet! (BTW, I still have an appetite like an 18 year old farm boy.)

The desire for more and new farm equipment seems almost insatiable, and begs the question:

Do we have all this equipment so we can farm, or do we farm so we can have all this equipment?

  • I recently met a young farmer who, while struggling to establish adequate cash flow, explained why another 4WD tractor on his 2,000ac farm will make him more efficient (he’s a sole operator with no hired help…how one man can drive more than one tractor at one time is something I can’t quite wrap my ahead around.)
  • You may recall from a few months ago the fictional story about “Fred” and how he NEEDED another combine. Despite his banker’s advice, he forged ahead.
  • Conversely, another farmer I speak with frequently is feverishly trying to rid himself of the over-abundance of iron on his farm.
  • Another is protecting his farm’s financial position by keeping the absolute bare minimum amount of equipment on his farm. Nowhere is there a “nice to have” piece of equipment on that farm; everything is “fully utilized.”

During the week of the June show in Regina, I read a tweet from an urban, non-farming young lady who was seeing the Farm Progress Show for the first time; it said (something along the lines of) “all this big beautiful equipment makes me want to go farming!”

Direct Questions

What circumstances must be present for you to consider additional equipment?

Does any equipment deal have to make for a sound business decision, or simply fill a desire?

Is your equipment a tool to operate your farm, or is it the reason you farm?

From the Home Quarter

In these weekly editorials, you have read about Mindset, about Strategy, and about Focus; these topics (and many of the others) challenge the conventional thinking in the industry today.

Those who bow to the mistress that is their farm equipment are only enjoying short term excitement. The mistress entices her suitor, subservient to the raucous cycle, and she soon becomes the one in charge.

Just ask anyone trying to get out of multiple leases…

asset rich cash poor

Asset Rich, Cash Poor (Kim Quoted in the News)

A tweet led to an email, which led to a phone call…

It was back in March that I tweeted the following:

This, and the short Twitter conversation that followed it, garnered an email, and then a telephone interview with Jennifer Blair from Alberta Farmer Express.

Below is an excerpt of what she wrote. For the article in its entirety, click here.

” ‘The funny thing about prosperity and successive years of prosperity is it allows people to form some really bad habits,’…

…And for those producers, being ‘asset rich and cash poor’ isn’t going to cut it anymore.

‘When you look back over the last two generations, it seems like the mantra has been that farmers are ‘asset rich and cash poor.’ It’s almost worn like a badge of honour,’ said Gerencser… ”

Direct Questions

What do you think? Have assets, especially equipment, been increased too fast to the detriment of cash holdings and future cash flow?

What is a reasonable level of investment in assets relative to your net profit? Are you earning an adequate return on your investment?

From the Home Quarter

Bad habits can form easily, but like any habit, bad ones can be broken. Chasing equity is something we’ve always done and that may have worked a generation ago, when the risks were as they are today but the volumes of cash at risk each year were far less. We cannot do what we’ve always done and expect a result different from what we’ve always gotten.

Asset rich and cash poor will not suffice through the next business cycle.

I’d like to hear your thoughts; leave a Reply below.

ROI and ROA equipment

Farm Acronym Challenge: ROI and ROA

ROI (return on investment) is a metric I lean on heavily when working with clients to illustrate an expectation of profit. Each farm deploys (what feels like) unprecedented volumes of capital every year in an effort to grow a crop; there should be an expectation of profit for doing so, and I expect my clients to demand an ROI that reflects the risk they take. Accepting lesser returns is insufficient and could be realized with less risk by deploying said capital elsewhere.

We can break down ROI by measuring a return on various aspects: crop inputs, investment in equipment, annual cash costs, etc. Some of the many options against which we can measure ROI are highly useful, others less so. We try to decide which metrics to measure based on which gives us the most useful information. Of course, the ability to have an accurate measurement of ROI depends entirely on quality information and your ability to collect it.

ROA (return on assets) is a measurement I will be using more in the future than I have in the past. More and more I am finding that there are excess assets on farms, especially equipment, that are using good capital yet providing an inadequate return.  Here is what I mean.

ROA is defined as a company’s net earnings relative to total assets. By dividing net earnings by total assets, we see how efficient management is at using assets to generate profit. A company that generates $1,000,000 in net earnings on $5,000,000 in assets has a 20% ROA. A similar company generating $1,000,000 profits with $10,000,000 in assets has a 10% ROA. It’s simple math. And the question begs: if you had invested $10,000,000 elsewhere, could you get better than a 10% return on those assets?

Before the argument about land values is thrown out there, let’s just curb it right away. Yes, ROA can be manipulated (as can ROE – return on equity) by owning fewer assets. Banks do it all the time: they sell their owned real estate such as stand alone bank branches and ivory office towers in order to lower their total assets, thereby making their profitability (when measured as ROA) look fantastic.

Today, let’s focus on the asset that gets much love: farm equipment.

How would we measure ROA when it comes to farm equipment? I prefer to use Fair Market Value (FMV) because that figure represents both what it would cost you to acquire said asset and what you could reap should you sell said asset; it is arguably the asset’s intrinsic value. Online searches and blue book values are great ways to validate FMV. I summarize it as “when the auctioneer’s gavel drops, what would you get for that piece of equipment?”

Focusing on ROA as it pertains to equipment only, and excluding land, levels the playing field so to speak. All things being equal, this approach will clarify which farm management team is efficient with how it invests in equipment, and which is not.

Direct Questions

How do you measure the effectiveness of your investment in assets, specifically equipment?

Are you over-invested or under-invested in equipment? What evaluation methods do you use to validate your position?

If you were to invest your capital elsewhere, what return would you expect? What return do you expect from your farm? Is there a difference? Why?

From the Home Quarter

When calculating ROA, consider multiple criteria: all assets (land, buildings, equipment;) land and equipment only; equipment only. The ROA will obviously be much lower when including more assets, but don’t let that sway you into selling land to improve your ROA. Land ownership has been, and will continue to be, the anchor of a farm’s wealth.

What is a target ROA? The jury is still out. Simply put, there isn’t a large enough sample with adequate accurate information available to draw from.

So let’s find out!

With the utmost confidence and maintaining your privacy always, I am proposing an experiment: Email to me your net earnings, your cultivated acres, and your fair market value for each of land, buildings, and equipment for 2015. I will compile the data with no identifying criteria so that you maintain privacy. The compiled data will be available only to those who take part in the experiment. Include 2014 and 2013 as well if you’d like to see how you are trending.

As a thank you for taking part, Growing Farm Profits will offer an analysis with feedback on your ROA  and ROI calculations and trends at NO CHARGE! (Normally a $470 value!)  – Offer expires April 20


farmer tailgate computer

Farm Profitability Indexing

Farm Profitability Indexing

Late in 2015, I picked up on some interesting farm financial info during a presentation I attended as a part of CAFA. This information represents farms from a geographically vast cross section and revealed some interesting trends:

1. Gross Revenue per Acre has Trended Up

Gross Revenue bar chart

With 2007 being the base year with a value of 100, and also being the first year of the bull run in commodity prices, we can clearly see that while gross revenues are trending up, there is still great volatility in gross farm receipts. True, weather anomalies had a significant effect, but that’s farming, isn’t it?

2. Investment in Crop Inputs per Acre has Trended Up

Inputs bar chart

While gross revenue has seen volatility, and for three years including 2009-2011 gross revenue was at or near 2007 revenue levels, investment in inputs has only once seen a reduction year over year. In 2013, investment in inputs was 77.5% higher per acre than it was in 2007.

3. Gross Margin per Acre has Trended Up

Gross Margin bar chart

While gross margin is trending up, there was a significant decline in 2009 from the previous year that extended right through 2011. Even by 2012, gross margin had not returned to 2008 levels.

4. Operating and Fixed Costs per Acre are Trending Up

Oper and Fixed Costs bar chart

This figure would represent operating costs such as fuel, labor, and equipment costs, as well as fixed costs such as interest, land, and building costs.  Notice the steady increase that has never went down year over year, even through the low margin years of 2009-2011 operating & fixed costs continued to rise.

5. Net Income per Acre has Rebounded from Significant Reductions

Net Income bar chart

Net Income represents what is left over after operating your business, that profit which remains to cover administrative costs, make principal loan payments, and cover that other insignificant cash requirement: living costs (that was sarcasm if you couldn’t tell.)

In this illustration, we have calculated Net Income simply as Gross Margin LESS Operating & Fixed costs. Here we see that the low margin years of 2009-2011 actually extend right to 2012 with net income still below that of our base year 2007. This is the residual effect of increasing costs during a period of low margins (2009-2011) by continuing to have a negative effect on what would otherwise be a successful year in 2012.

Everything Dips but Expenses

This chart illustrates a dangerous trend: even when income goes down, operating & fixed expenses are allowed to continue to rise.

farm profitability line chart

By the end of 2011, net income had dropped to less than 30% of 2007 levels, yet operating and fixed costs were over 145% of 2007 levels. It took 2013 bringing about the largest crop in maybe forever to elevate net income back to 2007 levels.

Direct Questions

If Net Income represents the funds you have generated to cover living costs and make loan payments, how well does your worst net income from the last 10 years cover your living and loan payments in 2016?

What does the trend of your gross income, input costs, operating costs, and net income look like since 2007? Is it similar to what’s been presented here? What changes have you made to your operation based on your own information?

Gross margin should ideally be in lock step with operating and fixed costs. If you aren’t increasing your gross margin, why are you increasing your costs?

From the Home Quarter

This is a very telling experiment, but it is not the rule on all farms. The information presented here is an average across a list that spans all regions of the prairies, but heavily weighted on Saskatchewan. The experiment gets more interesting when you apply it to your own business. To lean on the 5% Rule first promoted by Danny Klinefelter, if in 2013 you could have been 5% better than the average in gross revenue, input costs, and operating & fixed costs as presented here, your net income would be 44% better than information presented, and index to 152.14% of the 2007 base year.

How does that sound?


equipment efficiency

Managing Operating Efficiency

“You can’t manage what you don’t measure.” It’s been said time and time again, by me and many others. Here is an example that should get everyone buzzing.

A client of mine recently shared a sample of information that they collected from their equipment. The information shared with you is specifically from their sprayer:

Sprayer Utilization pie chart


A simple pie chart creates an “A-Ha Moment” that no one saw coming. I am sure you can all imagine the conversation around the table when this information was presented. What would your response be if this was your data?

As the discussion progressed, it became clear why the number of hours spent idling was what it was:

Admittedly, no one was tracking the number of idling hours that were attributable to any of those 4 points, but there was little argument that loading and rinsing contributed the largest share to the number of idle hours.

What can be done with this information? Since this sprayer is on a lease contract, the “cost per hour” is very easy to calculate. Now that we know the cost per hour of running this sprayer, we know how much all that idling costs. Now let’s go back to those 3 potential responses to first seeing this original data:

What this client of mine is now doing is evaluating the cost/benefit of putting a chem-injector system on their sprayer. Such an addition will:

To truly test this option, we would need accurate data over the period of at least 2-3 growing seasons measuring:

Naturally, very few, if any, farms record this data. Yet we can clearly see the effectiveness of having such useful information available to make the most informed decision possible. Without it, we are using emotion and our best guess. Obviously, our best guess can be way off, as is seen in just how much this sprayer spent idling in 2015.

Direct Questions

How are you managing and using your business data?

If you are not measuring it, and therefore cannot manage it, what are you using to make business decisions if accurate and useable data is not available?

How many decisions relating to improving efficiency can be made on your farm with better data?

From the Home Quarter

The report that contained this information (including the pie chart above) provides much greater detail to the goings on of that one machine than just usage by hour. Some of it, like the 8,970,000 yards this sprayer has traveled is not necessarily useful, but knowing that the 92.2hrs spent in transport used 910 gallons of fuel is.

While laughing and pointing around the table when comparing similar data from the combines, and identifying “who is the best combine operator” is interesting and fun, it is the action that comes out of the data that has the greatest impact. Positive action can and will impact your bottom line…but then so will inaction.