KYN Know Your Numbers

KYN: Profit Margin

“It’s not what you make, it’s what you keep!”

Prophetic words that apply to every business and simplifies the importance of profit.

Profit Margin is calculated as “Net Profit” divided by “Gross Revenue.” Essentially this calculation tells you how much of every dollar earned in gross revenue is actually profit. The smaller the profit margin, the less you keep.

It goes back over 10 years now to when I was a bank branch manager in a rural community. A client was trying to purchase a lake cottage and was upset with us that we weren’t clamoring to provide them with a mortgage. They worked very hard in their business that provided a service to the oilfield, and had expanded it several times by adding more trucks and employees. In one of their rants on me for not giving them what they wanted (it was more like “demanded” at this juncture) one of the partners (a married couple) said, “What does it take? We made a million dollars last year!” True, their top line revenue was exceeding $1,000,000 in the previous fiscal year; however, their net income – the profit – was just over $15,000. Even adding depreciation and interest back into the calculation (to arrive at EBITDA) there was no way they could service the mortgage they were requesting. Their profit margin was (in a simplified example) 0.015%, which meant that for every $1.00 in revenue they generated, they were retaining $0.015 in profits (1.5 cents profit for every dollar in revenue…hardly sustainable in a cyclical industry.)

What I Don’t Like About Profit Margin

  1. There are many variations on the calculation:
  • gross profit margin
  • operating margin
  • pretax profit margin
  • net margin…just to name a few. Each of these is measured slightly differently and has different meaning in different circumstances. If there isn’t sufficient care in assuring accurate nomenclature, things can get confusing.

2. The calculation, on face value, includes the non-cash depreciation expense (a tax figure) that often does not accurately portray the true market depreciation of an asset.

What I Do Like About Profit Margin

When calculated consistently over time, the trend will open up investigation and discussion on variances year over year (YoY) so that corrections can be made if necessary. I also like that it can be an internal benchmark, your own personal KPI (Key Performance Indicator) to which you could measure actual profit margin results against an ideal profit margin target that would fuel your business goals and growth aspirations.

Plan for Prosperity

What is a sufficient profit margin in your business? It is often relative to the industry in which you operate. If you have no idea, a good person to ask is your banker.

After spending virtually all of my professional career working on the financial and business aspects of agricultural production, I can confidently say that western Canadian grain farms need to target a 20% profit margin to sustain their businesses through the volatile cycles that affect the industry. “Target” because some years will blow right by 20%, other years will be low single digits (or negative numbers.) This truly is one space where bigger IS better!

Where has your profit margin measured out over the last 3-5 years? Which way is it trending? Why? If you don’t know the answers, or haven’t asked the questions, there is no time like right now to dig in.


KYN Know Your Numbers

KYN: Asset Turnover

In this edition of KYN: Know Your Numbers™

The Asset Turnover Ratio is one of my favorite metrics, especially when working with farm businesses. Despite what one may infer by the name, this ratio is not a promotion of turning over assets any faster than they already are. Quick turnover of assets is a major contributor to profitability challenges and cash flow challenges in the farm space.

In brief, the Asset Turnover Ratio is a measurement of how efficiently a business uses its assets to generate revenue. The calculation indicates how many dollars in revenue are generated by each dollar invested in assets. Higher is better.

The classic (textbook) version of the calculation is “Total Revenue” divided by “Average Total Assets.” So if your business generates $2.5million in revenue with $1million in average total assets, then your Asset Turnover Ration (ATR) is 2.5:1.0 (or for simplicity, just 2.5).

Here’s what I don’t like about Asset Turnover Ratio:

  • It uses “average” total assets. I have never liked using average; I feel “average” is way to make substandard performance look acceptable.
    But more to this case specifically, how do we “average” the total assets in your business? If you just take the total at the beginning and the end of the year and average those two figures, you will get an “average,” but how accurate is it? Should we be measuring assets each month and average 12 measurements? What about assets that are acquired then disposed of very quickly between measurement strike dates? I’m not a fan of average.
  • There is no clarity between which value to use when measuring assets (I.E. market value or book value)
  • The calculation does not, by definition, include leased assets (leasing has become quite popular.)
  • To be truly meaningful we must recognize that each industry has different Asset Turnover Ratios that are considered acceptable; sometimes the differences exist even within a similar space. Consider retailing: online retailers would have significantly lower investment in assets than retailers with brick & mortar store fronts. Online retailers would have significantly stronger ATR accordingly.

Once we clarify how we will approach the Asset Turnover Ratio, and maintain consistency in that approach so as to accurately trend your ATR metric over time, the ATR becomes a strong indicator of your business’ efficiency.

  1. Determine how you will value your assets:
    – when will you measure the asset values (frequency, date(s), etc.)
    – eliminate confusion and ambiguity…do two calculations, 1 with market value of assets, and 1 with book value
    – do not exclude assets under a capital lease, it will provide a false positive. Assets under a true “operating lease” can be excluded.
  2. Understand how your ATR applies to your industry. If there is a deviation in your results versus industry, is it stronger or weaker; what is causing it?

What I like about Asset Turnover Ratio:

  • it creates a stark illustration of how well a business utilizes its assets (which is a MAJOR draw on capital)
  • it is a key driver of ROA (Return on Assets – a KEY profitability ratio) and OPM (Operating Profit Margin – a KEY efficiency ratio) both of which need to be monitored closely
  • it shows the DOWNSIDE of asset accumulation (which, in the farm space, is a difficult conversation.)

Trending performed over many years by advisors with experience durations that are multiples of my own suggest that grain farms and cow/calf operations have ATR in the range of 0.33 to 0.17. Feedlots and dairies typically range from 1.0 to 0.5. User beware: these measurements are using the classical textbook definition.

Plan for Prosperity

As with any financial ratio, evaluating only one ratio does not tell the whole story. As with any financial analysis, how the numbers are quantified will have a profound effect on the results. This is not permission to ignore these important financial indicators, but more so a call to action to understand how each one affects your business so that you can make the informed decisions that will lead to profitable growth.

Not understanding the factors that affect your business is no excuse to ignore them…especially when they are within your control.

marking a bench 4

Benchmark Against the Best

Who do you look up to? It doesn’t have to be another business like yours, it can be anyone or any business. Why do you look up to that person or entity? What have they done that you want to emulate?

“If you benchmark yourself against the average you’ll be out of business in 5 years.”

Dr. David Kohl

What Dr. Kohl is referring to is that “average” is not success. As one client said this past week, “Average is the best of the worst, or the worst of the best; either way it’s not where we want to be.”

Personally, I’ve never been a fan of using averages when analyzing business performance. The sample pool will skew the calculation up or down; extenuating circumstances create anomalies in year-over-year business results; the list could go on. In my opinion, average is a useful tool to make yourself feel better about where you’re at. I prefer to make clients uncomfortable about where they’re at so that they are motivated to “Be Better™”.

Here’s someone we all know about who is never not trying to be better: Warren Buffett. Now don’t get me wrong, I’m not suggesting the Oracle of Omaha is without flaw or that he is somehow worthy of unwavering praise, but it cannot be denied that his approach to building wealth has enjoyed success beyond most of our wildest dreams. Recent articles in the Financial Post indicate that Berkshire Hathaway is currently sitting on about $116 Billion in cash and other short term investments. This cash is sitting idle for the purposes of making acquisitions, but Buffett has admitted that he’s struggled to find acquisitions at sensible prices. Also, the article states that Buffett is unwilling to load up on debt to finance deals at current prices.

“We will stick with our simple guideline: The less the prudence with which others conduct their affairs, the greater the prudence with which we must conduct our own,”

Warren Buffett.

It has been written in this series of commentaries that during the elongated commodity super-cycle which ran from about 2007 to 2015 we could find many “average” businesses who appeared to be “excellent”. The appearance of excellence was fed by strong yields and high commodity prices. To translate: everybody was making money, even the worst managers and the high cost operators. To paraphrase Dr. Kohl: when the bottom 20% of producers become profitable, we’re in trouble! It didn’t take much prudence to be profitable during the boom; how did you compare during the boom? How do you compare now?

So when considering who you want to mirror, is it one who has been racking up debt balls-out on the expansion train or one who has been quietly amassing a war-chest of financial strength that can be deployed when the right opportunity presents? Is it one who operates with reckless abandon, or strategic execution? Is it someone who is average, or is it the cream of the crop?

Plan for Prosperity

Benchmarking data is hard to come by; not everyone is willing to share the details of their successes or failures. So to start, benchmark against yourself. How did your most recent year stack up against your best year ever? How do your 2018 expense projections compare to your 2003 expenses? What has been the 10 year trend of your working capital, EBITDA, net profit, total debt, and total equity? Is it something you’d be proud to share? Let me know; I’d love to hear from you on what you learned from this exercise.

roi

Sustainability – What is It?

Are you sick of buzzwords? They’re everywhere…all the time. Some are actually impactful, but all are meaningless without context.

One buzzword that actually has some meat is “sustainability,” but in the next breath it’s meaningless because it can be over-used, misinterpreted, or put into the wrong context. Often times the word is attached to “environmental” sustainability and conjures up visions of environmental enthusiasts/activists/evangelists, but the term sustainability is simply defined as being able to last or continue for a long time.
Ref. https://www.merriam-webster.com/dictionary/sustainable

Using that frame of reference, let’s focus on the financial aspect.

You have put many changes in place in your business over the years. Ranging from new/improved processes to increased size & scale, each change has had an impact on your business. No question, your intention has always been to implement a change for the betterment of your business. But prior to initiating any action, was an assessment of the sustainability of the proposed change ever done? How did you quantify the impact of the change?

There are many success stories floating around lately about producers who gave up some rented land and increased their overall business profits from doing so. While this is counterintuitive to the deeply embedded mindset that “bigger is better,” clearly the financial sustainability of the status quo was in question for these particular operations.

What is the financial sustainability of increasing the size of the factory (more land), adding capacity (more/bigger/newer equipment), or increasing labor (more people)? Each of these needs to be evaluated beyond the obvious cash costs. What are the incidental costs, meaning:

  • Increasing the size of the factory (More Land) carries
    • Higher ownership/operating costs for PP&E (property, plant, & equipment);
    • More cash to service debt on the asset;
    • Change in insurance costs (which way will premiums go, up or down?)
    • Change in utilities costs (which way will heat and power go, up or down?)
    • More working capital to be able to utilize the increased scale of the business;
    • Etc.
  • Adding Capacity (More/Bigger/Newer Equipment) carries
    • Higher costs for PP&E (property, plant, & equipment);
    • More cash to service debt on the asset;
    • Change in insurance costs (which way will premiums go, up or down?)
    • Change in operating costs (which way will fuel and repairs go, up or down?)
    • Will you need to add staff (another operator)?
    • Will you need to upgrade your systems and/or technology so the new equipment can operate relatively seamlessly in your existing set-up?
  • Increasing Labor (More People) carries
    • Additional cost for benefits (pension, vacation, etc.)
    • Higher management requirement (to approve holidays, implement performance evaluations, conduct scheduling);
    • Any additional tools for employees to use (hand tools, vehicles, computers, etc.)
    • Training costs.

Each of these points above has an impact on the decision to increase the size of the factory, the capacity of the equipment, or the volume of human capital in your business. Evaluating each decision above with a broader perspective, which would include an expected ROI (Return on Investment), is the best way to understand the sustainability of each option. If the desired change to your business provides insufficient ROI, it puts the sustainability of not only the project but your entire business in question. At minimum, ROI must exceed the cost of borrowed capital that was utilized for the project.

Plan for Prosperity

Buzzwords aside, sustainability is as much of a mindset as it is a business practice. Sustainability deserves a place in your business’ values and mission & vision statements. It should make up a component of every business decision that you consider. If your business is not sustainable, what are your plans for afterwards?

Cash Growth and Misplaced Priorities

Cash, Growth, and Misplaced Priority

It’s been said many times by many pundits that “cash is king.” If you are a regular reader of my weekly commentary, you’ll know that I am not one who abides by that line of thinking because Cash Isn’t King. It’s the ACE!

However, GROWTH is King!

Growth is King and Cash is the Ace. What a tandem! It’s no wonder that in Texas Hold ‘Em poker, an Ace-King is known as “Big Slick.”

Recall that growth is not just about size and scale. Growth takes many forms; successful businesses “always grow, and grow all ways.”

The misplaced priority is when business pursues growth (expansion) at all costs, when it puts growth (expansion) above cash. I’ve seen businesses “grow” themselves to the brink of bankruptcy…

In an effort to spread out overhead costs, many businesses are driven to scale up. If rapid expansion is undertaken while in a weak financial position, the business has just been weakened further.

Cash is required to support any expansion plans. Expanding will not fix an insufficient cash position.

To Plan for Prosperity

Expansion plans must be carefully drawn up to ensure sufficient resources are available to support the goal. Expanding with insufficient resources, especially cash, can accelerate the decline of your business.


Complex Decision Making

Complex Decision Making

On October 21, 2017, Seth Godin wrote the following:

Decision making, after the fact

Critics are eager to pick apart complex decisions made by others.

Prime Ministers, CEOs, even football coaches are apparently serially incompetent. If they had only listened to folks who knew precisely what they should have done, they would have been far better off.

Of course, these critics have a great deal of trouble making less-complex decisions in their own lives. They carry the wrong credit cards, buy the wrong stocks, invest in the wrong piece of real estate.

Some of them even have trouble deciding what to eat for dinner.

Complex decision making is a skill—it can be learned, and some people are significantly better at it than others. It involves instinct, without a doubt, but also the ability to gather information that seems irrelevant, to ignore information that seems urgent, to patiently consider not just the short term but the long term implications.

The loudest critics have poor track records in every one of these areas.

Mostly, making good decisions involves beginning with a commitment to make a decision. That’s the hard part. Choosing the best possible path is only possible after you’ve established that you’ve got the guts and the commitment to make a decision.


With the benefit of hindsight, none of us is ever wrong. We can, without fear of reprisal, predict what just happened 5 minutes ago.

In business, we can not afford to avoid the complex decisions. Leaving it to chance or following the crowd is about as solid of a strategy as allowing “hope” to be your business plan…

In the next breath, we must cut ourselves some slack; large and complex decisions are daunting. It can seem easier to do nothing than to tackle a complex decision and risk making the wrong choice. But, as Godin wrote, “making good decisions involves beginning with a commitment to make a decision. That’s the hard part.”

To Plan for Prosperity

“Paralysis by analysis” is an old adage that accurately and humorously describes our inability to make a decision (and act on it) because we never stop considering different options. We might feel like a failure, or inept, if we don’t get the decision right.

In reality, more opportunities are lost from perfect inaction than there are mistakes made from imperfect action.

Halloween

Happy Halloween

Let me first get this off my chest.

In this age of hyper-political-correctness, to hear of some schools that are “cancelling” Halloween because of the risk that some costumes might “offend” or “scare” someone is taking us down a path that we may not be able to come back from. I’m not a proponent of Halloween, but I’ll gladly encourage anyone who wants to take part in it to do so, and anyone who doesn’t can also do so. What we need to remember is why we do it, even if we don’t love it…IT’S FOR THE KIDS!
It’s THEIR imagination and THEIR excitement that must not be squelched just to satisfy our guilt over ________ (fill in the blank).

Thank you; now onto the real business at hand.

Getting dressed up in a costume creates an outlet for us to be something we’re not, or maybe something we wish we could be. (As a kid, I wanted to be a pro-football player and might have dressed up as such for Halloween.)

Over the last several years in western Canadian agriculture, “average management” has been dressed up in a costume of “excellence.” With high yields and high commodity prices, even average managers were more profitable than they had been in the long term…maybe ever.

Dr. David Kohl uses the term “black swan” to describe the recent commodity super-cycle because, like a black swan, it is “not the norm.”

black swan is an event or occurrence that deviates beyond what is normally expected of a situation and is extremely difficult to predict;

Source: www.investopedia.com

While we might be inclined to associate black swan occurrences with negative deviations from normal, in the case of the last 10 years in agriculture, we’ve experienced a positive deviation from normal. The danger came when many participants in the industry believed that what was happening wasn’t actually a black swan but “the new normal.” Many long term decisions were made based on short term results. True to the black swan definition, the onset of the commodity super-cycle was predicted by very few, and even fewer still predicted it would last as long as it did. Maybe it was the fact that it did last longer than a year or two is why people started to believe it would never end…?

The unpredictability of this black swan continues to cause angst among players in the industry. Some are soldiering forward as they have for the last several years with full expectation that the black swan will return. Others are are in full damage control mode, or even panic mode. Others yet are patiently waiting for the opportunity that always follows the economic cycles.

Market cycles will hurt some, but offer opportunity to others.
The difference between who suffers and who prospers is…Who’s Ready.

– Kim Gerencser

I started making that statement way back in late 2012. The message then was to take advantage of the current up-cycle to solidify your business in preparation for the upcoming down-cycle (because bulls are always followed by bears, which are followed by bulls…it is how cycles work.) Being greedy during an up-cycle brings up another old adage, “Pigs get slaughtered.”

To Plan for Prosperity

When preparing your 2018 projections, compare your projected expenses to your worst revenue in the last 10 years. Is there a negative gap? How big is it? What needs to be done to cover it? Alternatively, is there a positive gap? How big is it? What needs to be done to protect it, or even to leverage it so as to make it wider?

The exercise proposed above is comparable to removing a Halloween costume. While things look one way outwardly, what is actually happening underneath, at the surface, can sometimes be much different and will tell the true story.

Happy Halloween!

PS. Don’t wear your Halloween costume to your banker meeting.

Soil Testing Home Farm

Soil Testing Season

This is the time of year when soil probes all over the prairie are taking samples of the soil that provided the crop in the current year and will provide another crop next year. It’s an annual “check-in” to see what’s left.

It was the same about a year ago. We check what nutrient levels remain after harvest, consider what crop will perform best in each field next year, and begin to apply appropriate nutrients (following the 4R’s of Fertility: Right Source, Right, Rate, Right Time, and Right Place) in fall and/or in spring. The crop get’s sown, produce get’s harvested, and we check the soil again. Based on what we started with, what we added, and what the crop used to through the growing season, we compare to what is left in the soil to evaluate how efficient our fertility program was.

If it wasn’t as efficient as it could have been, we examine the effects on our production (moisture, heat, disease, insects, etc.) and we examine our own role in the process by questioning if the seed tool did a good enough job; how about the sprayer? Often time we use weather as the justification to acquire bigger, newer equipment to “get the job done faster.”

What if the entire industry, not just the progressive managers but the entire industry, used that same methodology in analyzing profit and cash flow? It might look something like this:

This is the time of year when spreadsheets all over the prairie are being used to tally up the performance of the business over the last growing season. We start with the working capital we had after last harvest, consider what crop will perform best based on your crop rotation and market outlook, and begin to project input costs and yield & price for each crop. We enter expected operating and overhead costs into a projection, and convert those projections to “actuals” as the year progresses. Once harvest is complete, we evaluate working capital again.

If profitability and cash flow was insufficient to meet expectations, we examine if operating costs stayed within budget or not (and why), we examine if overhead costs were projected correctly or if we let both operating and overhead “get away” this year. What did we not foresee? What did we properly plan for? Did we market appropriately?

The practice of soil testing compliments crop and fertility planning. These are crucial steps to take to create the most efficient plan. Remember, you need to produce at the lowest cost per unit possible. Period. Hard Stop.

The practice of checking financial performance is similar to keeping score. It would be awfully tough to know what adjustments need to be made during the game (growing season) without knowing the score along the way.

To Plan for Prosperity

It’s been said by agronomists that soil testing is “seeing what’s in the bank account” and they carry on in supporting that analogy by stating that no one would write a cheque without knowing what the bank balance is first. Sadly, there any many people who do both: write cheques without knowing what’s in the bank and plant crops without knowing what’s in soil. One won’t break you, the other could.

Knowledge is power. Knowledge comes from management. Management requires measurement. Test your soil (financial performance), because if you don’t measure it, you can’t manage it.


**Side note: the photo is from my farming days, and provides a glimpse into the soil I used to farm. I found it interesting to so clearly see the A, B, and C horizons in a single core. **

Know the Signs

Know the Signs

When you see a cow that is limping, you check her out to see what the ailment is. A prudent cowperson can quickly recognize foot-rot and will tend to the cow to make her well again.

When you see yellowing bottom leaves and/or thin, spindly plants in the canola crop, you know it is lacking nitrogen. If you see the signs in time, you can top dress nitrogen fertilizer onto your crop and see a positive benefit.

When we see a tire is low, we fill it.
When we see windows are dirty, we clean them.
When we find the level of fuel in storage is low, we order more fuel.
When cash flow is abundant, we spend it in ways we wouldn’t usually spend it.
Yet, when working capital is depleted, when cash flow is tight, or when profitability is dicey, we typically soldier on…doing what we’ve always done.

This makes no sense. The last two sentences above make no sense at all.

When the bank account is empty and the line of credit is nearly full, do you:
a) Apply for more credit, at your primary lender or elsewhere?
b) Evaluate your cash outflow to date and reexamine your plans for the rest of the year?

When working capital as slipped down so low it would barely cover the crop inputs loan, do you:
a) Analyze what caused the current situation?
b) Seek action to rectify your working capital position?
c) Both a) and b) ?

The case for “knowing the signs” is made by acknowledging the impact of each risk that is identified.

In the crop, the yellowing of canola leaves won’t spur any action if the risk to yield potential is not understood.  If the risk is understood, then an informed decision can be made to act or not act. If there is no effort put in to understanding the risk, then the decision to act or not act falls somewhere between apathy and laziness. Being ignorant to the specifics of the risk and its implications is no longer an excuse now that we have access to all of humankind’s knowledge in our pocket…

If you’re unaware of what are the signs of nitrogen deficiency in canola, if you’re unaware of what are the risks of foot-rot in your cattle herd, you are best to seek advice from an expert.

To Plan for Prosperity

The risks of maintaining insufficient working capital, and the risks from shortfalls in cash flow, are obvious to those of us who specialize in the financial side of business. We know the signs. We know what it takes to fix it. We know what should happen to ensure the situation isn’t repeated.


top producer

Are You a Top Producer?

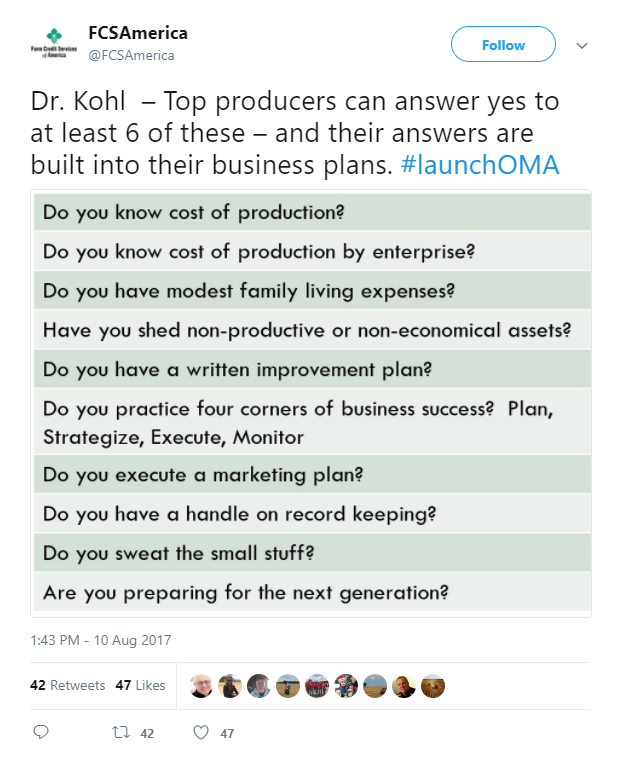
Esteemed economist, Dr. David Kohl, is a fervent advocate of improving business decision making. In one of his recent speaking engagements, Dr. Kohl suggested that top producers can answer Yes to at least six of the following questions.

Top Producer Kohls questions

With only 10 questions on the slate, a positive response to only 6 of them would make you a top producer.
You’ll note that nowhere in those 10 questions will you find anything about actual production…

To Plan for Prosperity

If you are unable to answer YES to at least 6 of Dr. Kohl’s questions, then I suggest you do an internal audit on yourself and your business to determine why. If you are unsure about where to start in doing such an audit, or how to make the changes necessary to be able to answer Yes to 6 of 10 questions, then pick up the phone – I can help.

If six-out-of-ten makes you a top producer, imagine how strong your business would be if you hit 10/10…