ROI and ROA equipment

Farm Acronym Challenge: ROI and ROA

ROI (return on investment) is a metric I lean on heavily when working with clients to illustrate an expectation of profit. Each farm deploys (what feels like) unprecedented volumes of capital every year in an effort to grow a crop; there should be an expectation of profit for doing so, and I expect my clients to demand an ROI that reflects the risk they take. Accepting lesser returns is insufficient and could be realized with less risk by deploying said capital elsewhere.

We can break down ROI by measuring a return on various aspects: crop inputs, investment in equipment, annual cash costs, etc. Some of the many options against which we can measure ROI are highly useful, others less so. We try to decide which metrics to measure based on which gives us the most useful information. Of course, the ability to have an accurate measurement of ROI depends entirely on quality information and your ability to collect it.

ROA (return on assets) is a measurement I will be using more in the future than I have in the past. More and more I am finding that there are excess assets on farms, especially equipment, that are using good capital yet providing an inadequate return.  Here is what I mean.

ROA is defined as a company’s net earnings relative to total assets. By dividing net earnings by total assets, we see how efficient management is at using assets to generate profit. A company that generates $1,000,000 in net earnings on $5,000,000 in assets has a 20% ROA. A similar company generating $1,000,000 profits with $10,000,000 in assets has a 10% ROA. It’s simple math. And the question begs: if you had invested $10,000,000 elsewhere, could you get better than a 10% return on those assets?

Before the argument about land values is thrown out there, let’s just curb it right away. Yes, ROA can be manipulated (as can ROE – return on equity) by owning fewer assets. Banks do it all the time: they sell their owned real estate such as stand alone bank branches and ivory office towers in order to lower their total assets, thereby making their profitability (when measured as ROA) look fantastic.

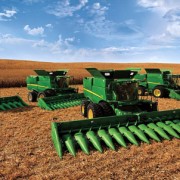
Today, let’s focus on the asset that gets much love: farm equipment.

How would we measure ROA when it comes to farm equipment? I prefer to use Fair Market Value (FMV) because that figure represents both what it would cost you to acquire said asset and what you could reap should you sell said asset; it is arguably the asset’s intrinsic value. Online searches and blue book values are great ways to validate FMV. I summarize it as “when the auctioneer’s gavel drops, what would you get for that piece of equipment?”

Focusing on ROA as it pertains to equipment only, and excluding land, levels the playing field so to speak. All things being equal, this approach will clarify which farm management team is efficient with how it invests in equipment, and which is not.

Direct Questions

How do you measure the effectiveness of your investment in assets, specifically equipment?

Are you over-invested or under-invested in equipment? What evaluation methods do you use to validate your position?

If you were to invest your capital elsewhere, what return would you expect? What return do you expect from your farm? Is there a difference? Why?

From the Home Quarter

When calculating ROA, consider multiple criteria: all assets (land, buildings, equipment;) land and equipment only; equipment only. The ROA will obviously be much lower when including more assets, but don’t let that sway you into selling land to improve your ROA. Land ownership has been, and will continue to be, the anchor of a farm’s wealth.

What is a target ROA? The jury is still out. Simply put, there isn’t a large enough sample with adequate accurate information available to draw from.

So let’s find out!

With the utmost confidence and maintaining your privacy always, I am proposing an experiment: Email to me your net earnings, your cultivated acres, and your fair market value for each of land, buildings, and equipment for 2015. I will compile the data with no identifying criteria so that you maintain privacy. The compiled data will be available only to those who take part in the experiment. Include 2014 and 2013 as well if you’d like to see how you are trending.

As a thank you for taking part, Growing Farm Profits will offer an analysis with feedback on your ROA  and ROI calculations and trends at NO CHARGE! (Normally a $470 value!)  – Offer expires April 20


farmer tailgate computer

Farm Profitability Indexing

Farm Profitability Indexing

Late in 2015, I picked up on some interesting farm financial info during a presentation I attended as a part of CAFA. This information represents farms from a geographically vast cross section and revealed some interesting trends:

1. Gross Revenue per Acre has Trended Up

Gross Revenue bar chart

With 2007 being the base year with a value of 100, and also being the first year of the bull run in commodity prices, we can clearly see that while gross revenues are trending up, there is still great volatility in gross farm receipts. True, weather anomalies had a significant effect, but that’s farming, isn’t it?

2. Investment in Crop Inputs per Acre has Trended Up

Inputs bar chart

While gross revenue has seen volatility, and for three years including 2009-2011 gross revenue was at or near 2007 revenue levels, investment in inputs has only once seen a reduction year over year. In 2013, investment in inputs was 77.5% higher per acre than it was in 2007.

3. Gross Margin per Acre has Trended Up

Gross Margin bar chart

While gross margin is trending up, there was a significant decline in 2009 from the previous year that extended right through 2011. Even by 2012, gross margin had not returned to 2008 levels.

4. Operating and Fixed Costs per Acre are Trending Up

Oper and Fixed Costs bar chart

This figure would represent operating costs such as fuel, labor, and equipment costs, as well as fixed costs such as interest, land, and building costs.  Notice the steady increase that has never went down year over year, even through the low margin years of 2009-2011 operating & fixed costs continued to rise.

5. Net Income per Acre has Rebounded from Significant Reductions

Net Income bar chart

Net Income represents what is left over after operating your business, that profit which remains to cover administrative costs, make principal loan payments, and cover that other insignificant cash requirement: living costs (that was sarcasm if you couldn’t tell.)

In this illustration, we have calculated Net Income simply as Gross Margin LESS Operating & Fixed costs. Here we see that the low margin years of 2009-2011 actually extend right to 2012 with net income still below that of our base year 2007. This is the residual effect of increasing costs during a period of low margins (2009-2011) by continuing to have a negative effect on what would otherwise be a successful year in 2012.

Everything Dips but Expenses

This chart illustrates a dangerous trend: even when income goes down, operating & fixed expenses are allowed to continue to rise.

farm profitability line chart

By the end of 2011, net income had dropped to less than 30% of 2007 levels, yet operating and fixed costs were over 145% of 2007 levels. It took 2013 bringing about the largest crop in maybe forever to elevate net income back to 2007 levels.

Direct Questions

If Net Income represents the funds you have generated to cover living costs and make loan payments, how well does your worst net income from the last 10 years cover your living and loan payments in 2016?

What does the trend of your gross income, input costs, operating costs, and net income look like since 2007? Is it similar to what’s been presented here? What changes have you made to your operation based on your own information?

Gross margin should ideally be in lock step with operating and fixed costs. If you aren’t increasing your gross margin, why are you increasing your costs?

From the Home Quarter

This is a very telling experiment, but it is not the rule on all farms. The information presented here is an average across a list that spans all regions of the prairies, but heavily weighted on Saskatchewan. The experiment gets more interesting when you apply it to your own business. To lean on the 5% Rule first promoted by Danny Klinefelter, if in 2013 you could have been 5% better than the average in gross revenue, input costs, and operating & fixed costs as presented here, your net income would be 44% better than information presented, and index to 152.14% of the 2007 base year.

How does that sound?


equipment efficiency

Managing Operating Efficiency

“You can’t manage what you don’t measure.” It’s been said time and time again, by me and many others. Here is an example that should get everyone buzzing.

A client of mine recently shared a sample of information that they collected from their equipment. The information shared with you is specifically from their sprayer:

Sprayer Utilization pie chart


A simple pie chart creates an “A-Ha Moment” that no one saw coming. I am sure you can all imagine the conversation around the table when this information was presented. What would your response be if this was your data?

As the discussion progressed, it became clear why the number of hours spent idling was what it was:

Admittedly, no one was tracking the number of idling hours that were attributable to any of those 4 points, but there was little argument that loading and rinsing contributed the largest share to the number of idle hours.

What can be done with this information? Since this sprayer is on a lease contract, the “cost per hour” is very easy to calculate. Now that we know the cost per hour of running this sprayer, we know how much all that idling costs. Now let’s go back to those 3 potential responses to first seeing this original data:

What this client of mine is now doing is evaluating the cost/benefit of putting a chem-injector system on their sprayer. Such an addition will:

To truly test this option, we would need accurate data over the period of at least 2-3 growing seasons measuring:

Naturally, very few, if any, farms record this data. Yet we can clearly see the effectiveness of having such useful information available to make the most informed decision possible. Without it, we are using emotion and our best guess. Obviously, our best guess can be way off, as is seen in just how much this sprayer spent idling in 2015.

Direct Questions

How are you managing and using your business data?

If you are not measuring it, and therefore cannot manage it, what are you using to make business decisions if accurate and useable data is not available?

How many decisions relating to improving efficiency can be made on your farm with better data?

From the Home Quarter

The report that contained this information (including the pie chart above) provides much greater detail to the goings on of that one machine than just usage by hour. Some of it, like the 8,970,000 yards this sprayer has traveled is not necessarily useful, but knowing that the 92.2hrs spent in transport used 910 gallons of fuel is.

While laughing and pointing around the table when comparing similar data from the combines, and identifying “who is the best combine operator” is interesting and fun, it is the action that comes out of the data that has the greatest impact. Positive action can and will impact your bottom line…but then so will inaction.

even emergence

Farm Financial and Business Information – Best Practices

Recently, I read an article that listed the “Top 10 Ag Data Platforms of 2015.” I recognized only 2 of them. Clearly, the choices available to producers in finding and using an appropriate data template is abundant. In recognizing that this does pose challenges in trying to decide which one to use, several of them offer a free trial period: use the service for a set amount of time and if you’re not happy, they’ll refund your fees. Can’t lose, right?

Like so many other aspects of life and business, going on the cheap, finding the lowest cost solution, spending as little as possible often has the opposite effect than what is desired. When I needed steel toed work boots for the farm, I used to spend about $120 for “cheap” boots from the discount or department store. The last pair I bought were Red Wing and cost me well over $300. They outlasted 2-3 “cheap” pair and my feet were far more comfortable during those long 18 hour days at seeding, keeping me less fatigued. Was there greater value in the more expensive boots? You bet there was!

If cost is your #1 concern when considering options for managing your data and business information, then please consider why you buy the name brand hand tools, cars, trucks, and farm equipment that you do? If cost was the only concern, wouldn’t we all be driving cheap $10,000 cars, using WalMart wrenches made in China, and farming with Belarus tractors?

Find what works for you and just use it. If you don’t know what works for you, then ask for help. I am meeting with an office organization expert this week to get the help I need in creating a work-space that is better organized and more suited to my work flow.

Last week we discussed “Using Your Financial Information,” but if you aren’t managing your information adequately, it will be difficult to use, and leave you to make decisions with information that is not accurate. We expect our financial institution to provide us with accurate statements, and we’d be pretty upset if the information they provided us wasn’t spot on. We need to have the same expectation of ourselves.

If doing your own income and expense entries, set aside 1 hour twice a week to input accounting data. I used to leave mine until it was time to file GST every quarter. I have found that there is value to letting my accountant’s office handle this task so I can focus on my business. In 2016, I’ll be leaving the data entry to my accountant.

The first piece of information I prefer to offer to new clients is a Unit Cost of Production calculation. This requires current and accurate figures for crop inputs, yield and price, operating costs, and overhead costs. To know what it costs to produce one bushel of canola or one tonne of barley on your farm requires accurate info, otherwise it’s still a guess! Using this accurate information is very empowering!

Here is a list of Best Practices to consider implementing for managing your farm’s financial and business data:

  • Research and fully utilize an agronomic data platform; ideally it would require minimal manual entry on your part by gleaning info from your tractor/sprayer/combine consoles, and also easily convert to your accounting software.
  • Manage income and expenses regularly: don’t simply fill the shoe-box! Designate 1 hour twice per week to data entry.
  • Evaluate the worth of your time relative to tasks you do, and delegate accordingly.
    (IE. if you’re the CEO helping the hired men sweep out bins, you’re not allocating your time very well!)
  • Consider using outside help, or a designated employee, to manage date entry if you deduce that your time is better spent elsewhere.
  • Keep income & expenses, assets & liabilities, and cash flow records current each month.

Direct Questions

How are you best utilizing the resources you have available to compile your data? Are you using the right people, or slugging through on your own?

What data and information management tools are you using? Do they satisfy your needs? How are you using the reports they create?

Does managing financial information take a back seat to other tasks? What do you need to make it more of a priority?

From the Home Quarter

Choosing an information management platform is a daunting task. But it is less daunting than trying to make informed decisions with little or no usable information. The learning curve is steep at the beginning, yet once you’ve done all your set-up, keeping it updated is relatively easy. Making information management a priority can be less easy, depending on mindset. The benefits you’ll enjoy from being equipped to make informed decisions immediately as required are similar to the benefits you enjoy from getting your entire crop seeded early into warm moist soil. Even emergence on an early seeded crop is as satisfying as highly informed strategic management decisions…and just as important!

analyzing finances at the bin

Using Your Financial Information

Last week, we described how compiling your financial information will be beneficial to you in being able to analyze your previous year’s results so as to equip yourself in making informed decisions in the current, and future, years. This week, we discuss how to use that info.

Critical Balance Sheet Metrics

  1. Your Current Assets should be greater than your Current Liabilities by an amount that at least matches your cost to put in next year’s crop.
    Ideally, the difference between current assets and current liabilities should at minimum match your entire costs to run your farm for one year.
  2. You want your Total Liabilities to be no more than your 125% of your equity after net worth adjustments have been made.
  3. ROE is an acronym for Return On Equity. It is your net income divided by your net equity. Are you happy with the returns you’ve earned in each of the last 5 years?

Critical Income Statement Metrics

  1. First and foremost, is your Income Statement accrued? You can tell if you find an adjustment, up or down, to your income that would be labelled “inventory adjustment.” If your income statement is not accrued, call me for a quick description on how to do it yourself. It’s easy.
    Accruing your income statement is the only way to truly measure your profitability from the crop produced in a specific year.
  2. Did you have a profit? EBITDA (Earnings Before Interest Taxes Depreciation & Amortization) is a very important figure to know. It represents your profitability from operations; it shows you can generate profits. The calculation is Net Income + Interest Paid + Taxes Paid + Depreciation Expensed.
  3. Now that you’ve got EBITDA calculated, divide it by the following figures: Current Portion of Long Term Debt (found on balance sheet) + ALL interest paid (found on income statement) + ALL lease payments made (found on income statement). This is an important indicator for your lenders. This figure indicates to them your capacity to meet your financing obligations.

Critical Cash Flow Statement Metrics

  1. Cash Flow from Operations divided by Gross Sales indicates how many dollars in cash your business generates from every dollar in sales. The higher the figure, the better.
  2. Cash Flow from Operations divided by your “Property, Plant & Equipment” indicates how well your business uses its hard assets to generate cash.
  3. Cash from Financing divided by Cash from Operations indicates how dependent your business is on financing. The higher the figure, the more dependent on external money.

Solvency Calculations

Liquidity Calculations

Liabilities / net worth current assets / current liabilities
EBITDA / loan payments, interest & leases current assets – current liabilities


Direct Questions

Does the thought of doing such calculations overwhelm you, scare you, or just plain bore you? If the urgency of knowing these numbers doesn’t strike urgency into you, are you willing to ask for help?

How would you describe the benefit to your decision making if these figures were readily available?

From the Home Quarter

The comment has been made time and time again: “It’s easy to make money in the good times.” With tighter margins of late, more attention than ever before is being paid to management and finances. These calculations above are only a few of the measurements that you can take to gauge your financial strength or weakness.

And if you need a hand figuring out what to do next, contact me any time.